Home /
Expert Answers /
Economics /
help-please-the-graph-shows-the-market-for-tomato-pickers-in-southern-california-what-is-the-equil-pa841
(Solved): help please! The graph shows the market for tomato pickers in southern California. What is the equil ...
help please!
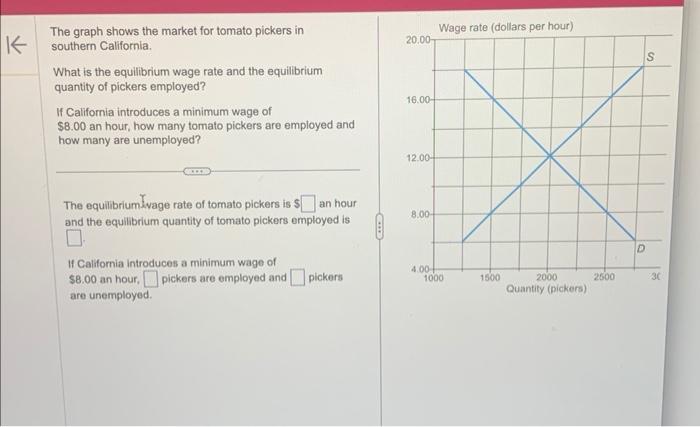
The graph shows the market for tomato pickers in southern California. What is the equilibrium wage rate and the equilibrium quantity of pickers employed? If California introduces a minimum wage of \( \$ 8.00 \) an hour, how many tomato pickers are employed and how many are unemployed? The equilibrium ivage rate of tomato pickers is \( \$ \) an hour and the equilibrium quantity of tomato pickers employed is If California introduces a minimum wage of \( \$ 8.00 \) an hour, pickers are employed and pickers are unemployed.