Home /
Expert Answers /
Economics /
help-please-consider-the-market-illustrated-in-the-figure-to-the-right-supply-curve-s1-represe-pa806
(Solved): help please! Consider the market illustrated in the figure to the right. Supply curve S1 represe ...
help please!
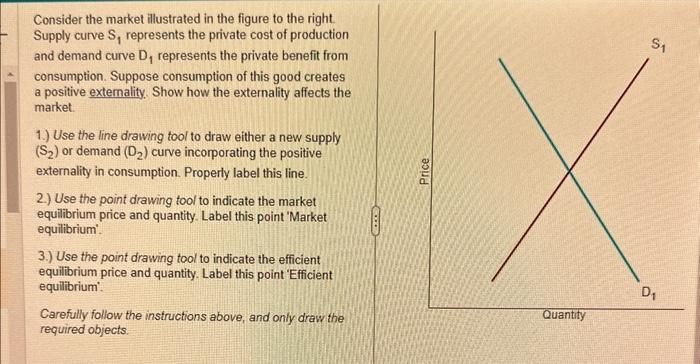
Consider the market illustrated in the figure to the right. Supply curve represents the private cost of production and demand curve represents the private benefit from consumption. Suppose consumption of this good creates a positive externality. Show how the externality affects the market. 1.) Use the line drawing tool to draw either a new supply or demand curve incorporating the positive externality in consumption. Properly label this line. 2.) Use the point drawing tool to indicate the market equilibrium price and quantity. Label this point 'Market equilibrium: 3.) Use the point drawing tool to indicate the efficient equilibrium price and quantity. Label this point 'Efficient equilibrium'. Carefully follow the instructions above, and only draw the required objects.
Expert Answer
Solution:A positive externality occurs when the viewer benefits from the activity. For example, when someon