Home /
Expert Answers /
Earth Sciences /
help-meee-the-graph-below-illustrates-an-area-of-the-ocean-called-the-pycnocline-using-the-graph-an-pa395
(Solved): help meee The graph below illustrates an area of the ocean called the pycnocline. Using the graph an ...
help meee
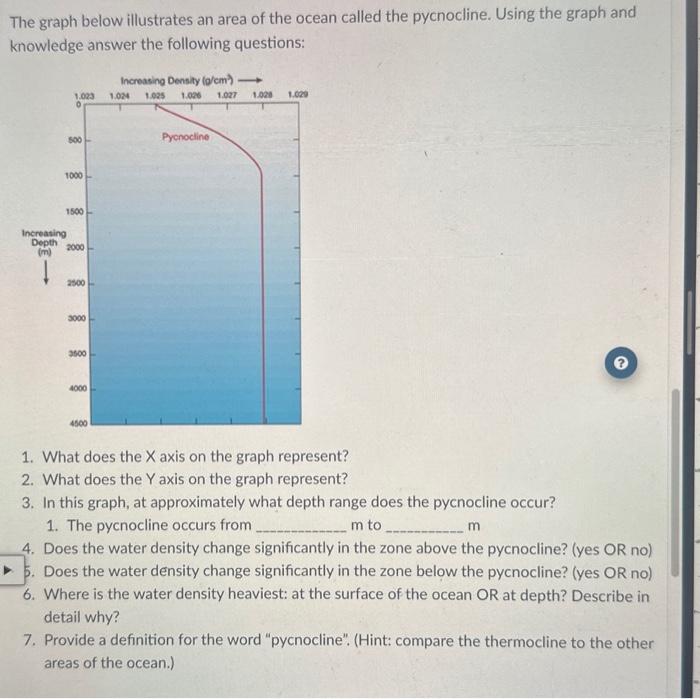
The graph below illustrates an area of the ocean called the pycnocline. Using the graph and knowledge answer the following questions: 1. What does the axis on the graph represent? 2. What does the axis on the graph represent? 3. In this graph, at approximately what depth range does the pycnocline occur? 1. The pycnocline occurs from to 4. Does the water density change significantly in the zone above the pycnocline? (yes OR no) i. Does the water density change significantly in the zone below the pycnocline? (yes OR no) 6. Where is the water density heaviest: at the surface of the ocean OR at depth? Describe in detail why? 7. Provide a definition for the word "pycnocline". (Hint: compare the thermocline to the other areas of the ocean.)
Expert Answer
Question 1: The x axis on the graph is showing Increasing density in the units of g/cm³.