Home /
Expert Answers /
Chemical Engineering /
generating-geothermal-power-figure-6-schematic-model-of-a-geothermal-power-plant-the-chart-below-pa626
(Solved): generating geothermal power Figure 6. Schematic model of a geothermal power plant. The chart below ...
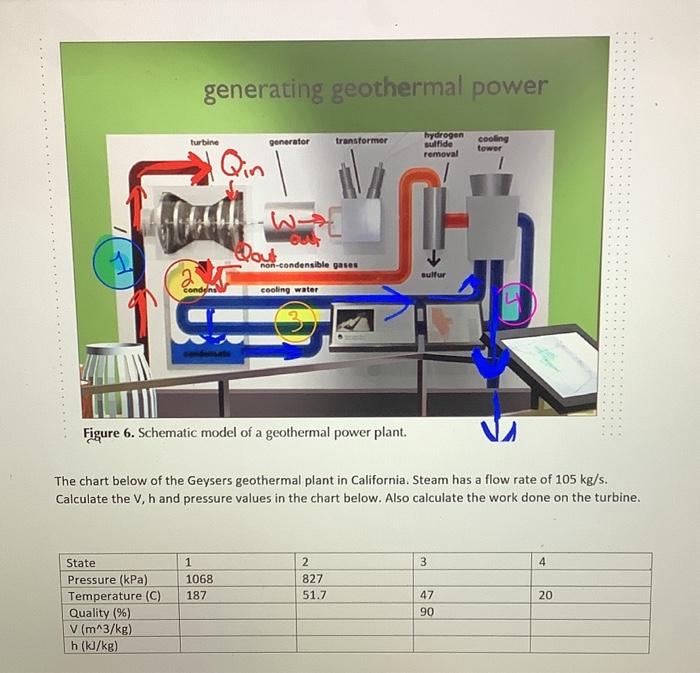
generating geothermal power Figure 6. Schematic model of a geothermal power plant. The chart below of the Geysers geothermal plant in California. Steam has a flow rate of \( 105 \mathrm{~kg} / \mathrm{s} \). Calculate the \( \mathrm{V}, \mathrm{h} \) and pressure values in the chart below. Also calculate the work done on the turbine.