Home /
Expert Answers /
Operations Management /
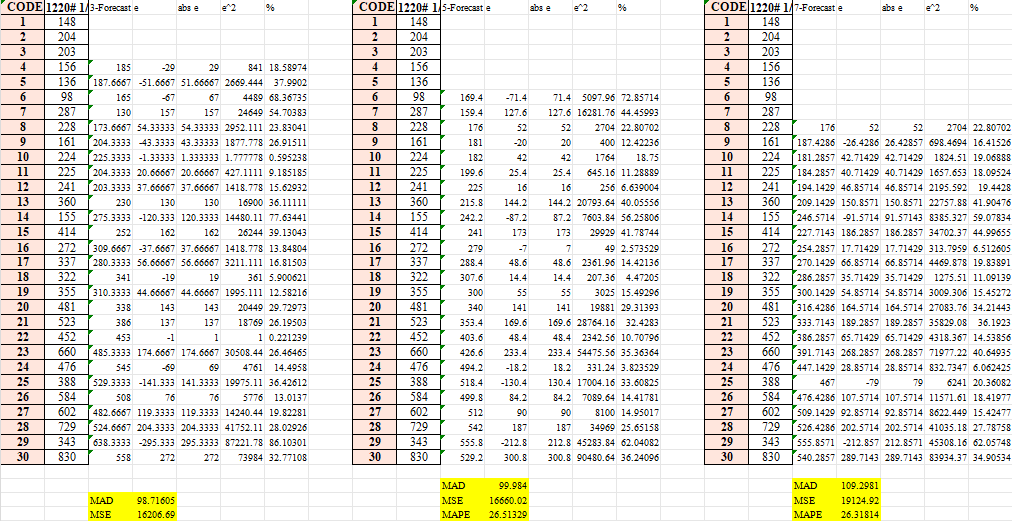
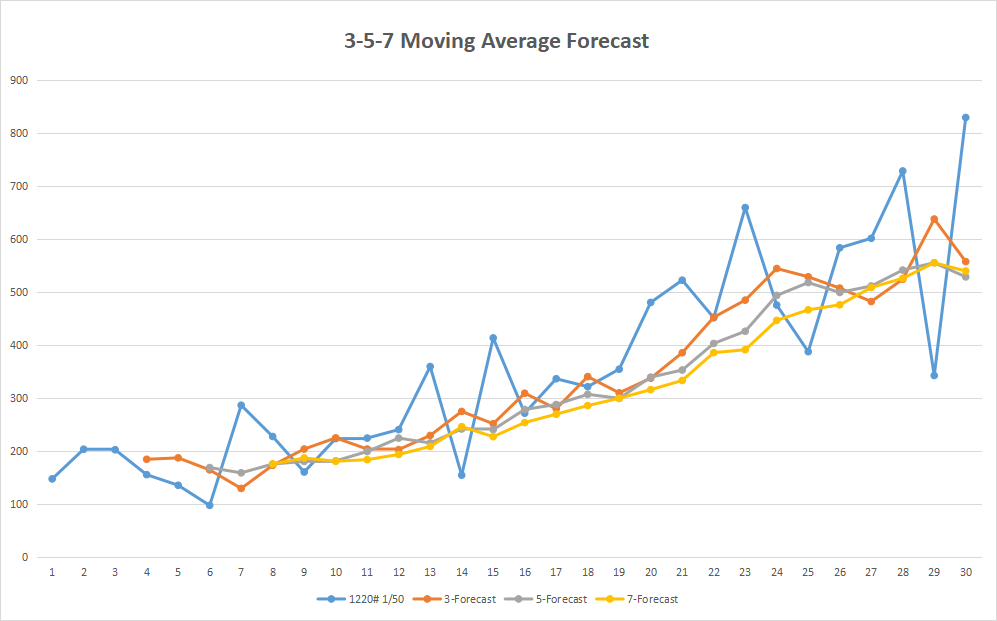
from-the-tables-above-i-have-the-chart-below-the-question-is-how-i-can-describe-that-chart-about-40-pa919
Expert Answer
Step 1: Data Trend The cha...

