Home /
Expert Answers /
Biology /
for-the-graph-shown-above-roughly-sketch-what-this-graph-would-look-like-if-the-ligand-concentratio-pa724
(Solved): For the graph shown above, roughly sketch what this graph would look like if the ligand concentratio ...
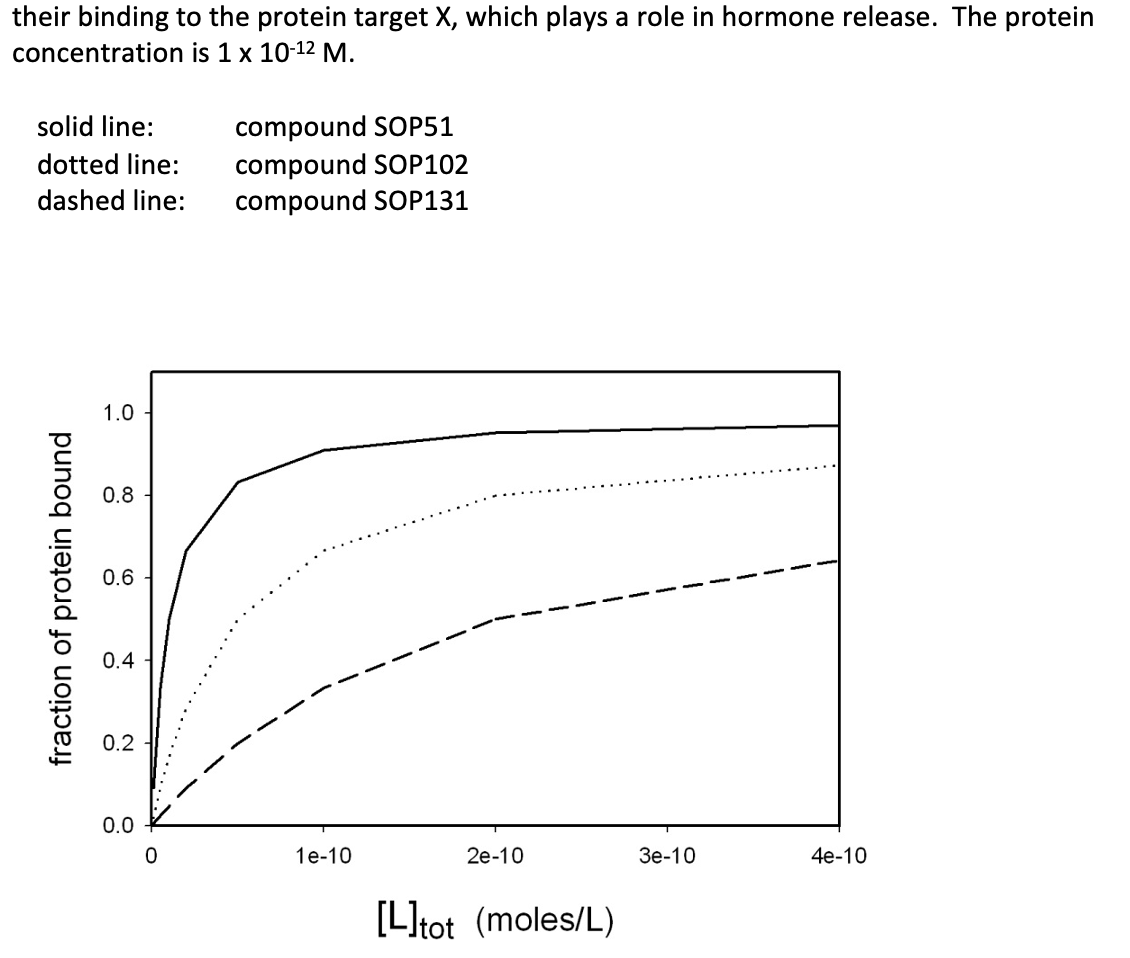
For the graph shown above, roughly sketch what this graph would look like if the ligand concentration axis is plotted logarithmically. Label the Kd values on this graph.
their binding to the protein target \\( \\mathrm{X} \\), which plays a role in hormone release. The protein concentration is \\( 1 \\times 10^{-12} \\mathrm{M} \\).
Expert Answer
The hormone is a naturally occurring molecule secreted by both plants and animals that control phy...
