Home /
Expert Answers /
Statistics and Probability /
for-the-data-and-sample-regression-equation-shown-below-do-the-following-a-decide-at-the-10-si-pa754
(Solved): For the data and sample regression equation shown below, do the following. a. Decide, at the 10% si ...
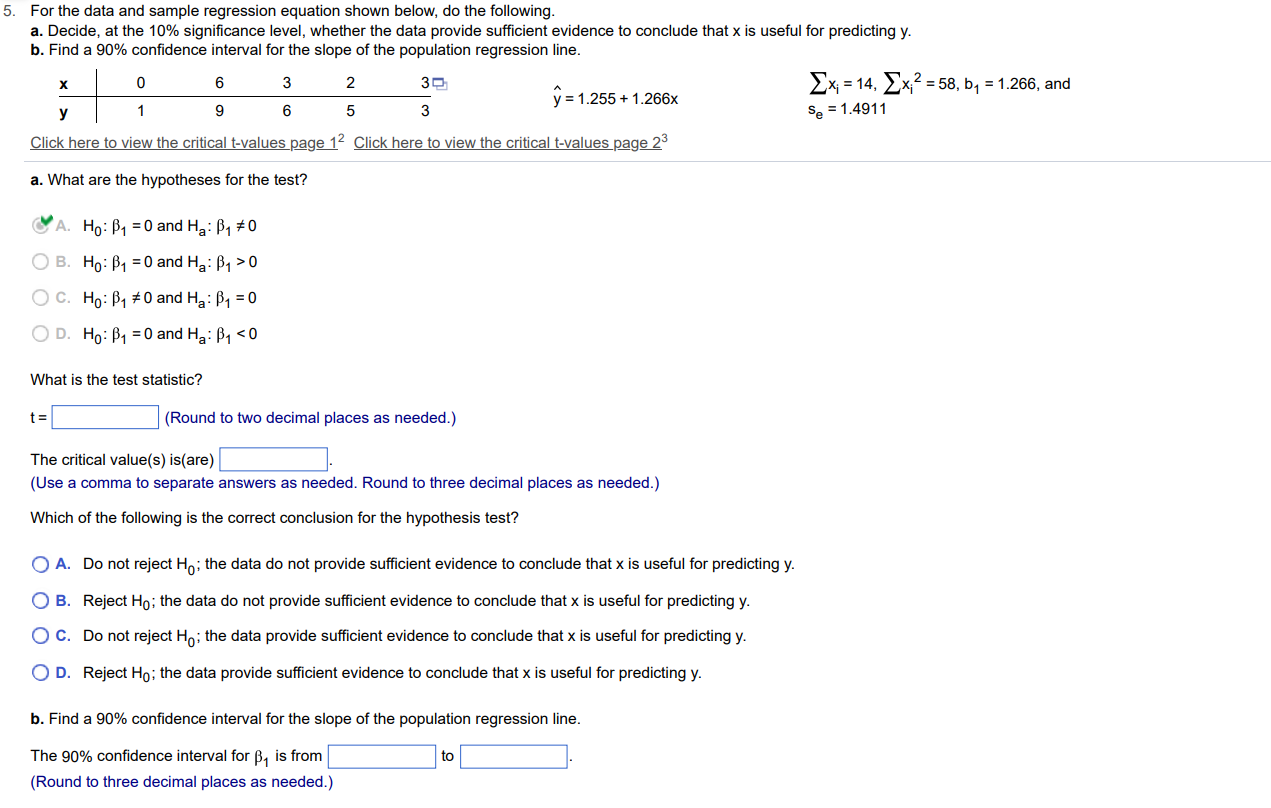
For the data and sample regression equation shown below, do the following. a. Decide, at the significance level, whether the data provide sufficient evidence to conclude that is useful for predicting . b. Find a confidence interval for the slope of the population regression line. Click here to view the critical t-values page Click here to view the critical t-values page a. What are the hypotheses for the test? A. and B. and C. and D. and What is the test statistic? (Round to two decimal places as needed.) The critical value(s) is(are) (Use a comma to separate answers as needed. Round to three decimal places as needed.) Which of the following is the correct conclusion for the hypothesis test? A. Do not reject ; the data do not provide sufficient evidence to conclude that is useful for predicting . B. Reject ; the data do not provide sufficient evidence to conclude that is useful for predicting . C. Do not reject ; the data provide sufficient evidence to conclude that is useful for predicting . D. Reject ; the data provide sufficient evidence to conclude that is useful for predicting . b. Find a confidence interval for the slope of the population regression line. The confidence interval for is from to (Round to three decimal places as needed.)