(Solved): Find the indicated z score. Th ...
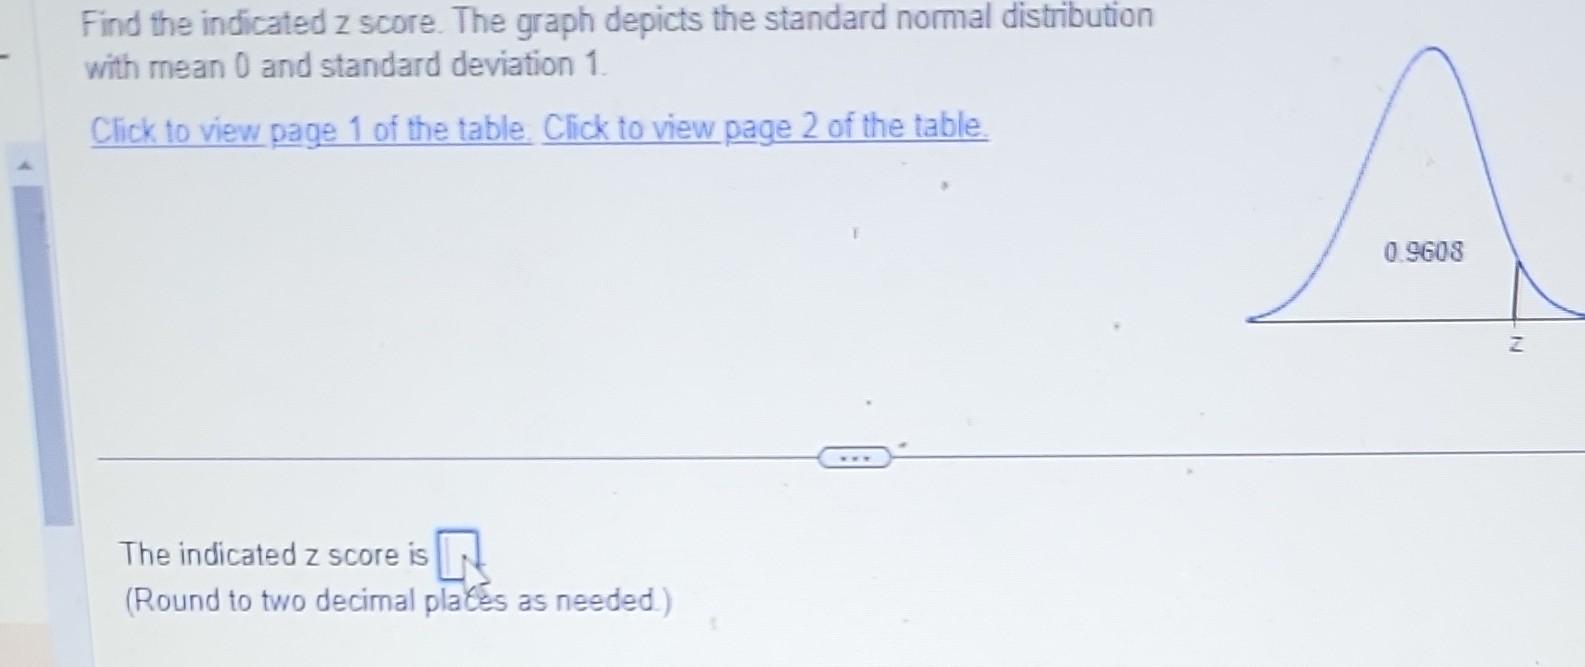
Find the indicated z score. The graph depicts the standard normal distribution with mean 0 and standard deviation 1 . Click to view page 1 of the table. Click to view page 2 of the table. The indicated score is (Round to two decimal plates as needed.)
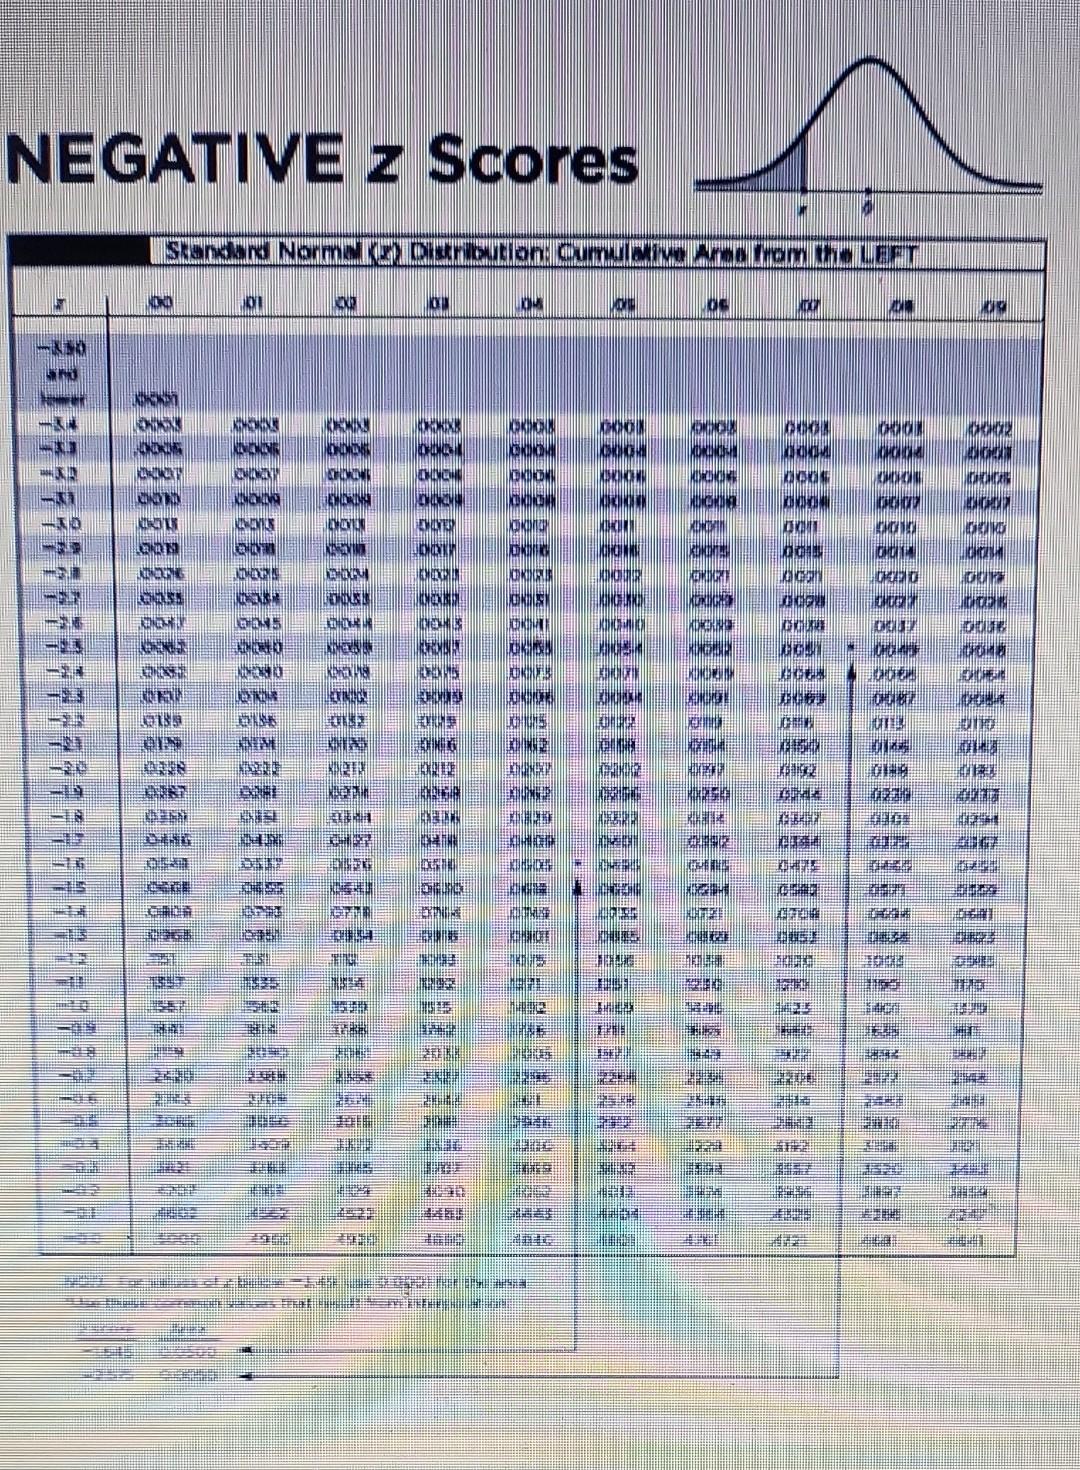
NEGATIVE z Scores
sed0DS z NILISOd
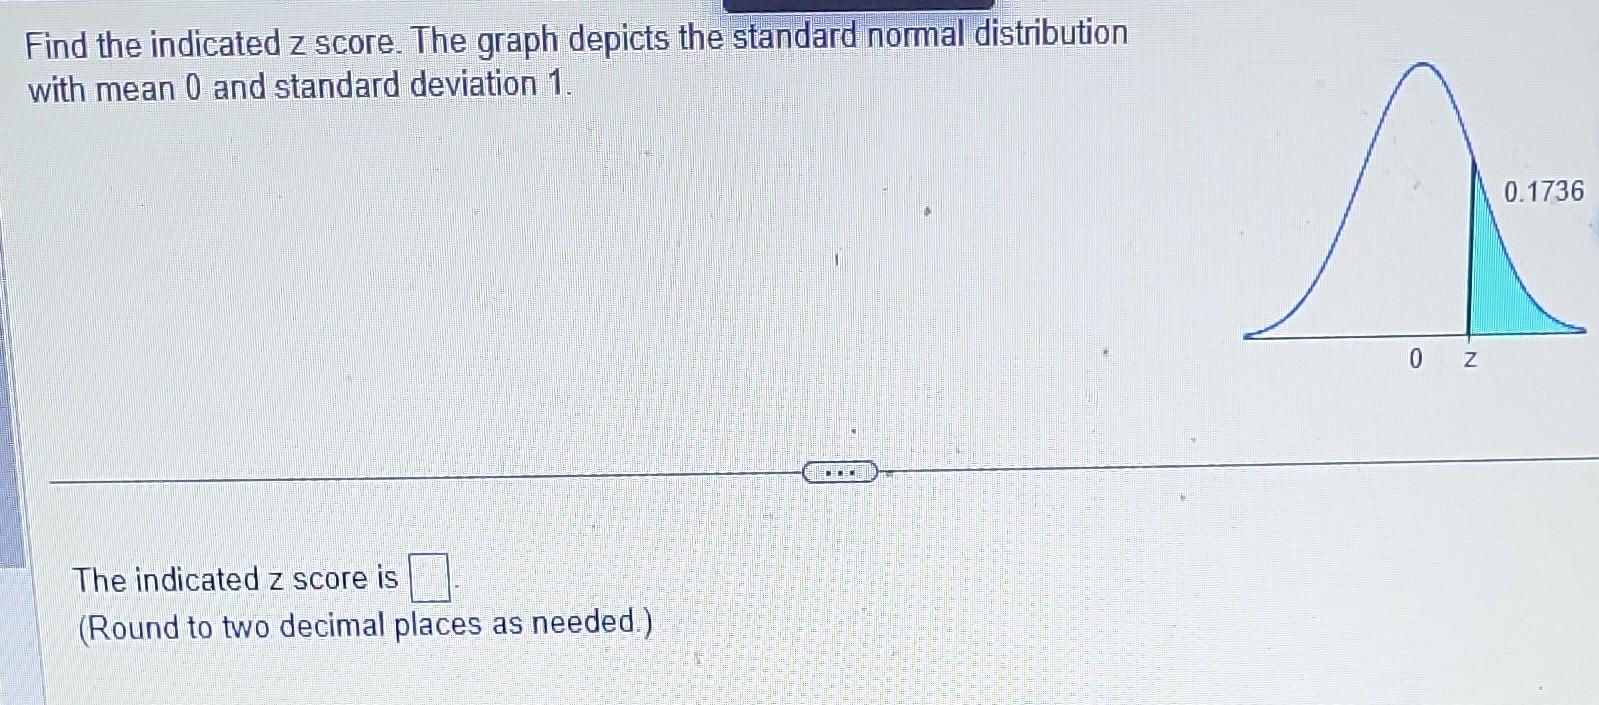
Find the indicated z score. The graph depicts the standard normal distribution with mean 0 and standard deviation 1 . The indicated score is (Round to two decimal places as needed.)
Find the area of the shaded region. The graph to the right depicts scores of adults, and those scores are normally distributed with a mean of 100 and a standard deviation of 15. Click to view page 1 of the table. Click to view page 2 of the table. The area of the shaded region is (Round to four decimal places as needed.)
NEGATIVE z Scores
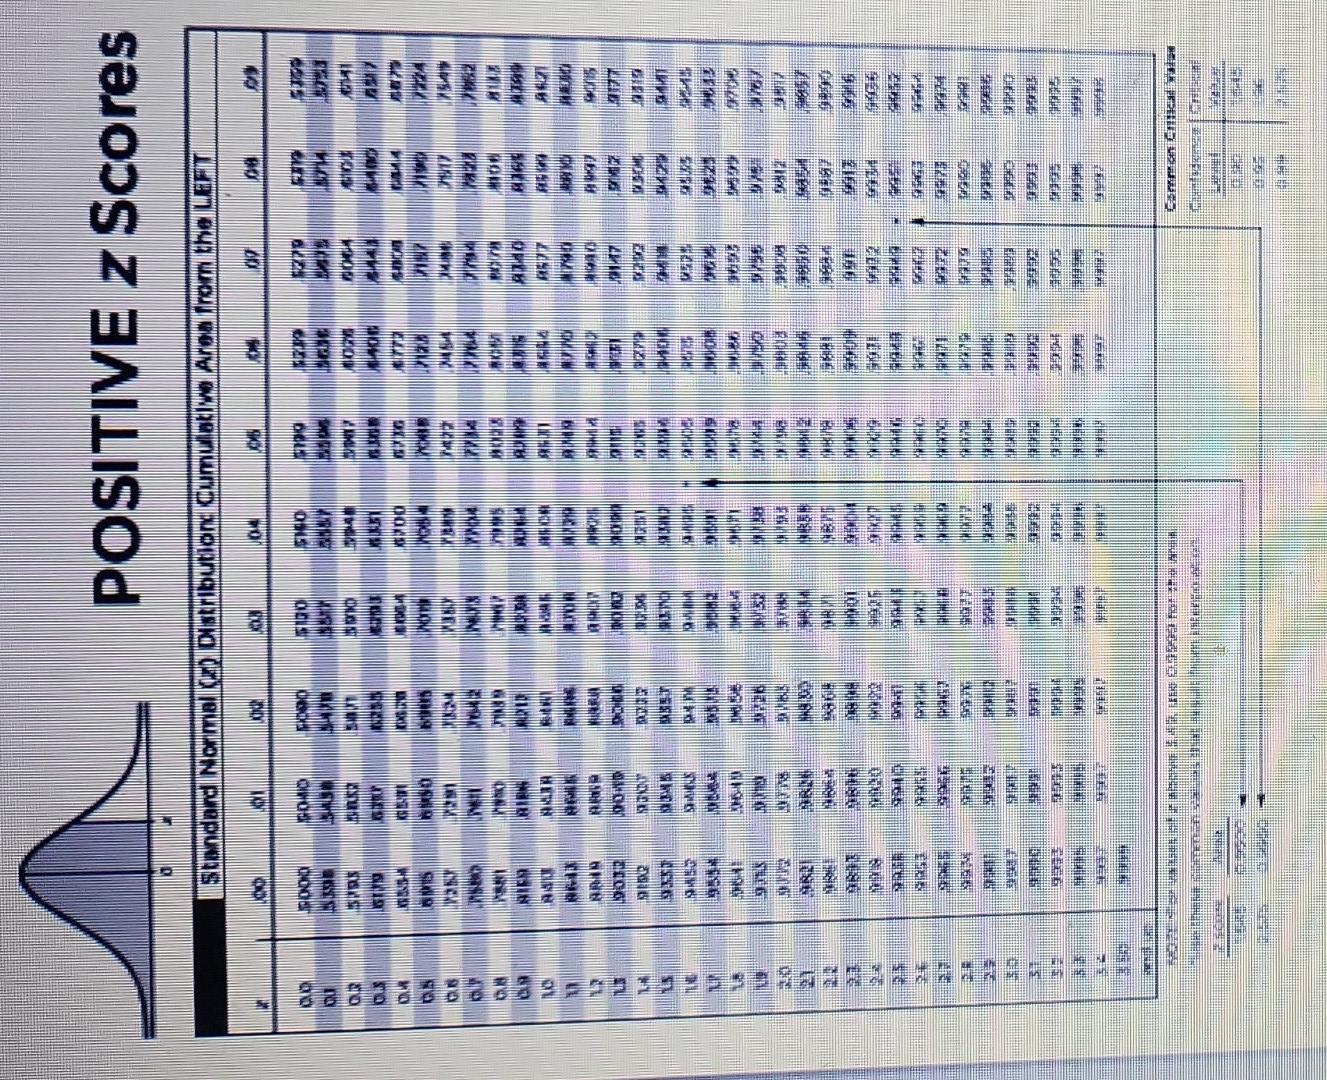
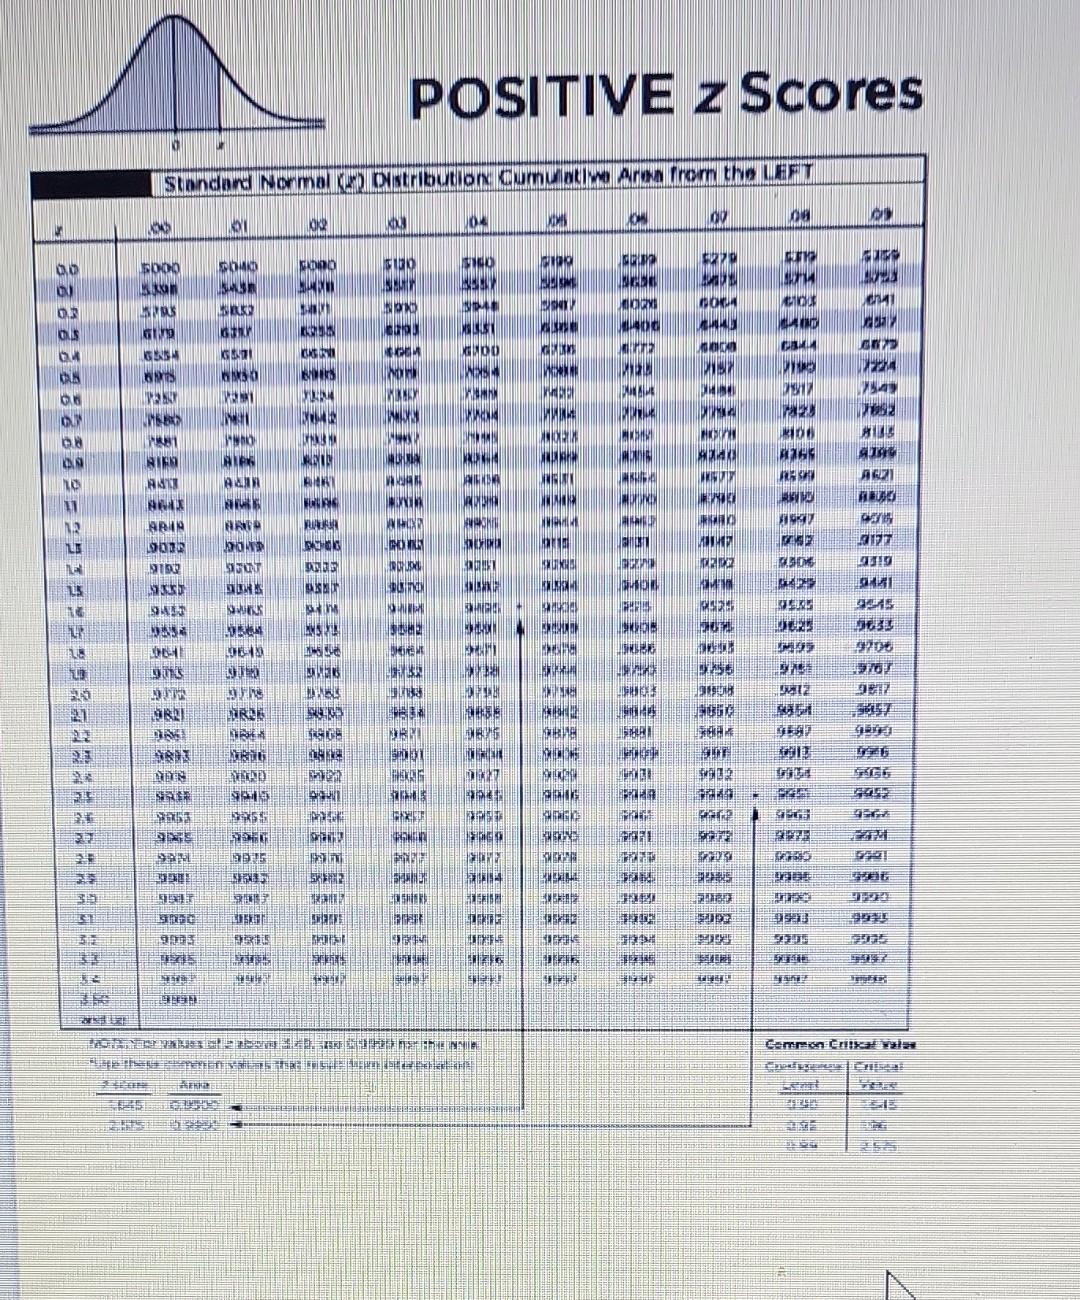
POSITIVE z Scores
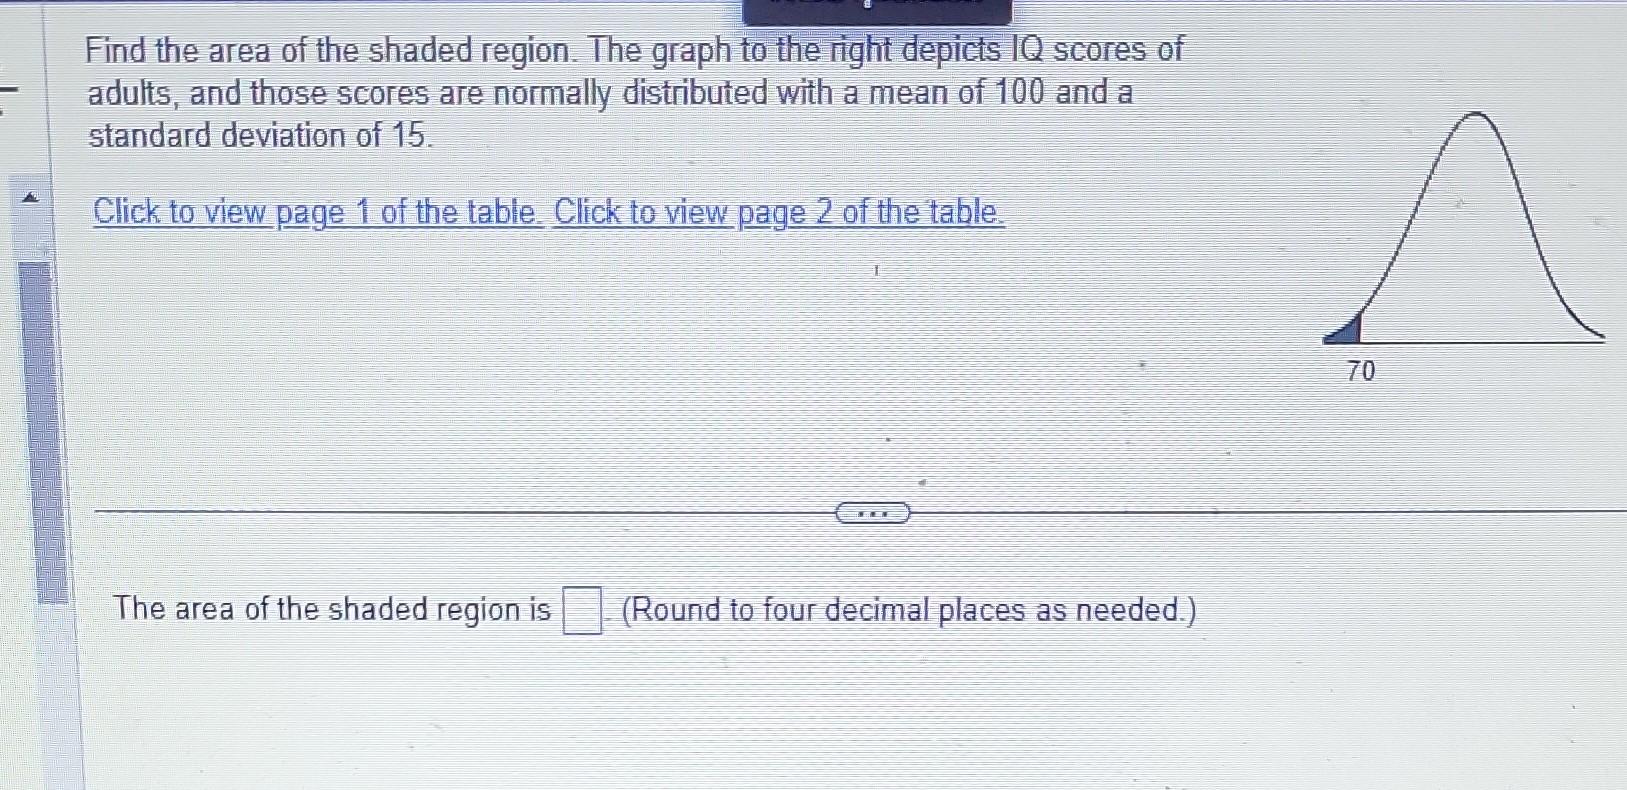
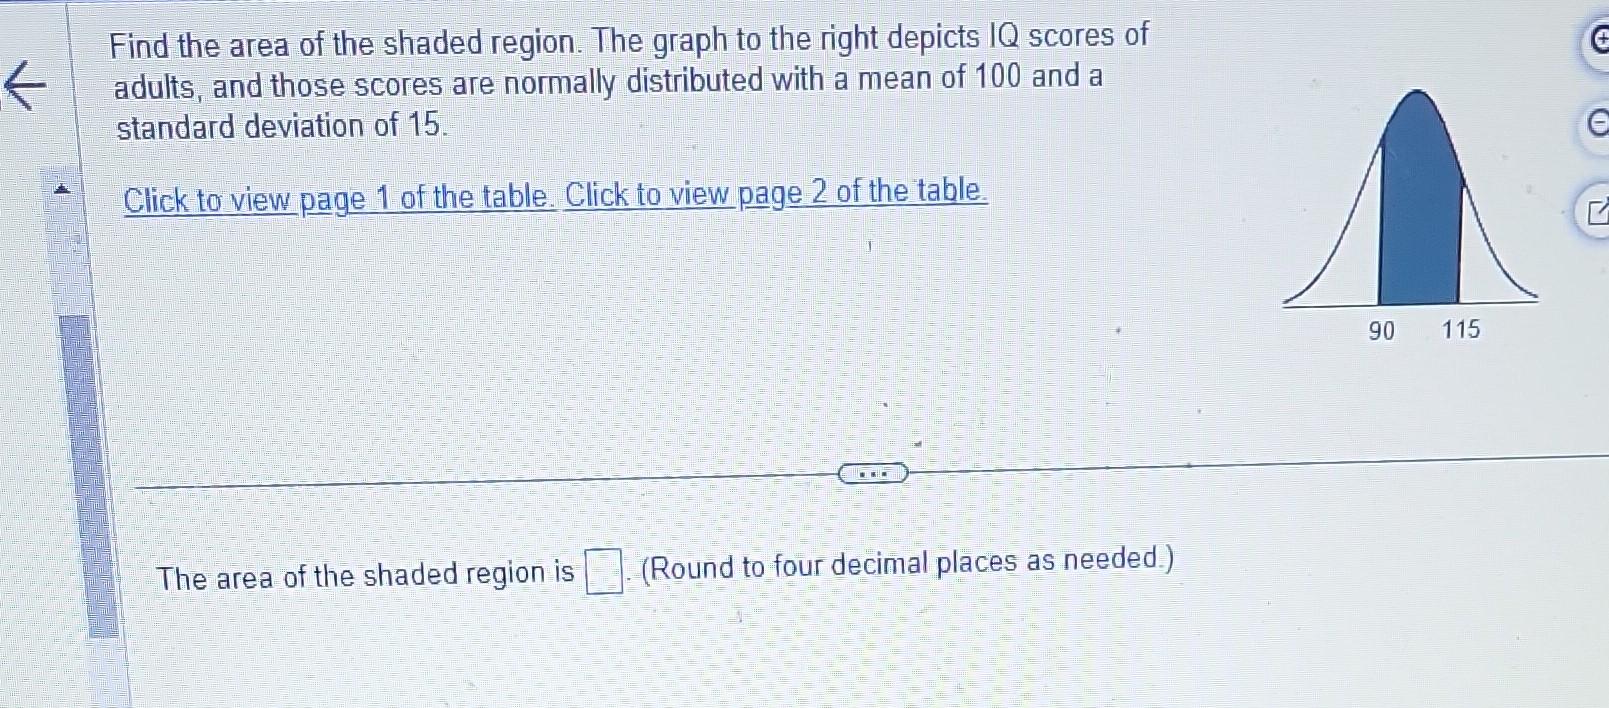
Find the area of the shaded region. The graph to the right depicts IQ scores of adults, and those scores are normally distributed with a mean of 100 and a standard deviation of 15 . Click to view page 1 of the table. Click to view page 2 of the table. The area of the shaded region is (Round to four decimal places as needed.)
NEGATIVE z Scores
POSITIVE z Scores
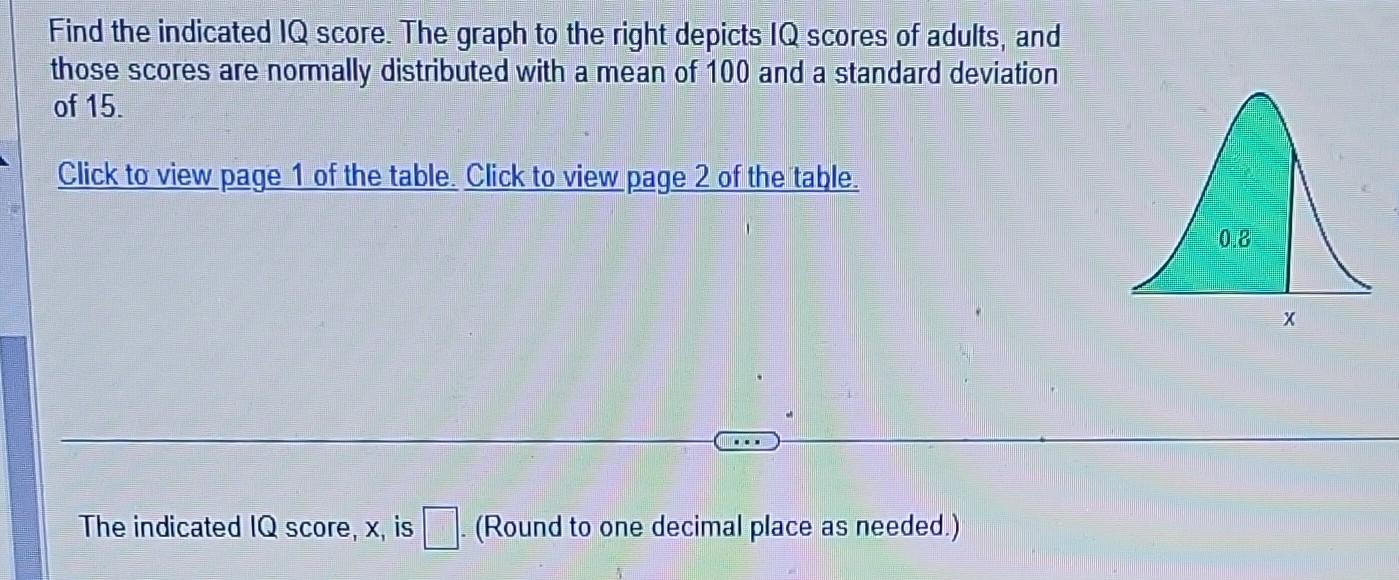
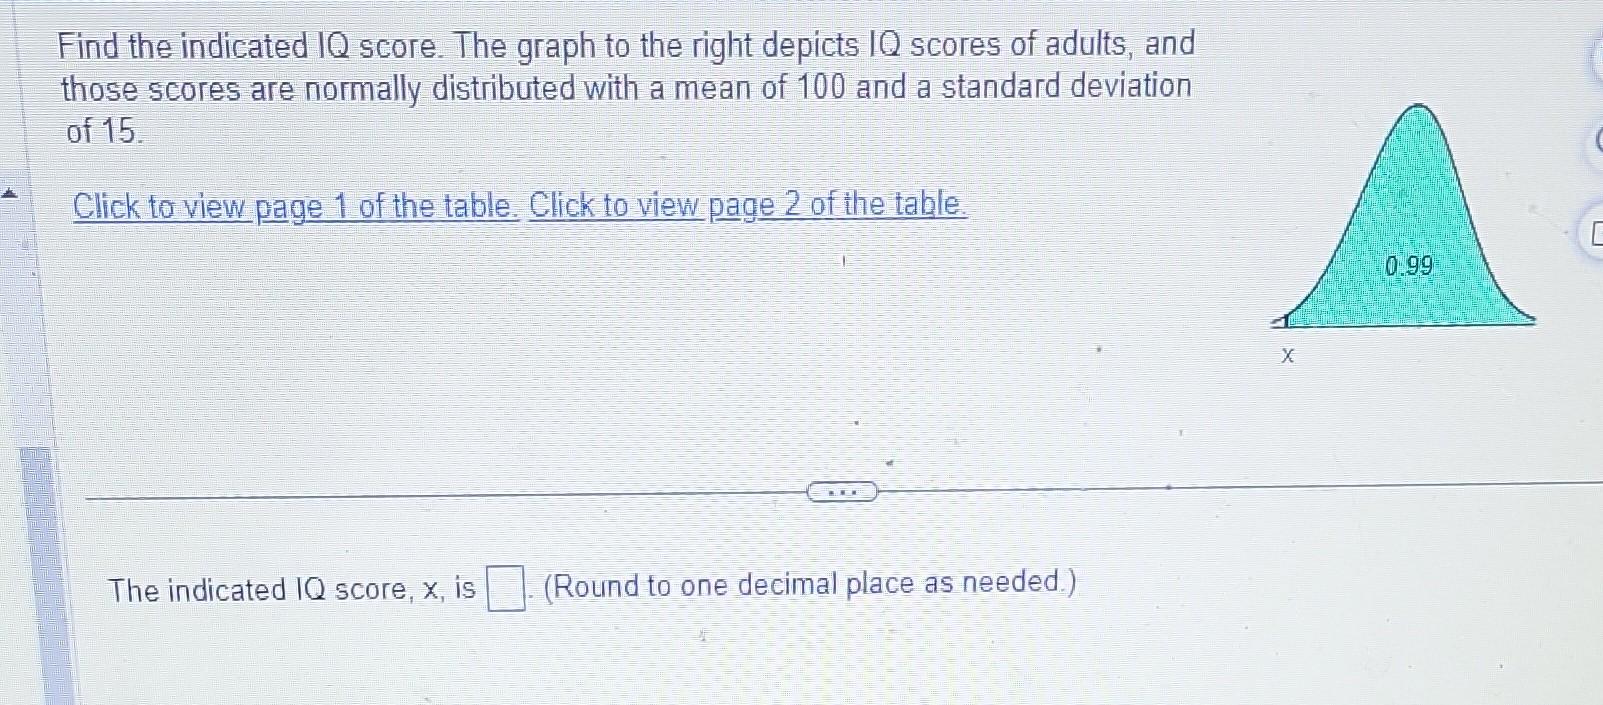
Find the indicated IQ score. The graph to the right depicts IQ scores of adults, and those scores are normally distributed with a mean of 100 and a standard deviation of 15. Click to view page 1 of the table. Click to view page 2 of the table. The indicated IQ score, , is (Round to one decimal place as needed.)
NEGATIVE z Scores
POSITIVE z Scores
Find the indicated score. The graph to the right depicts scores of adults, and those scores are normally distributed with a mean of 100 and a standard deviation of 15. Click to view page 1 of the table. Click to view page 2 of the table. The indicated IQ score, , is (Round to one decimal place as needed.)
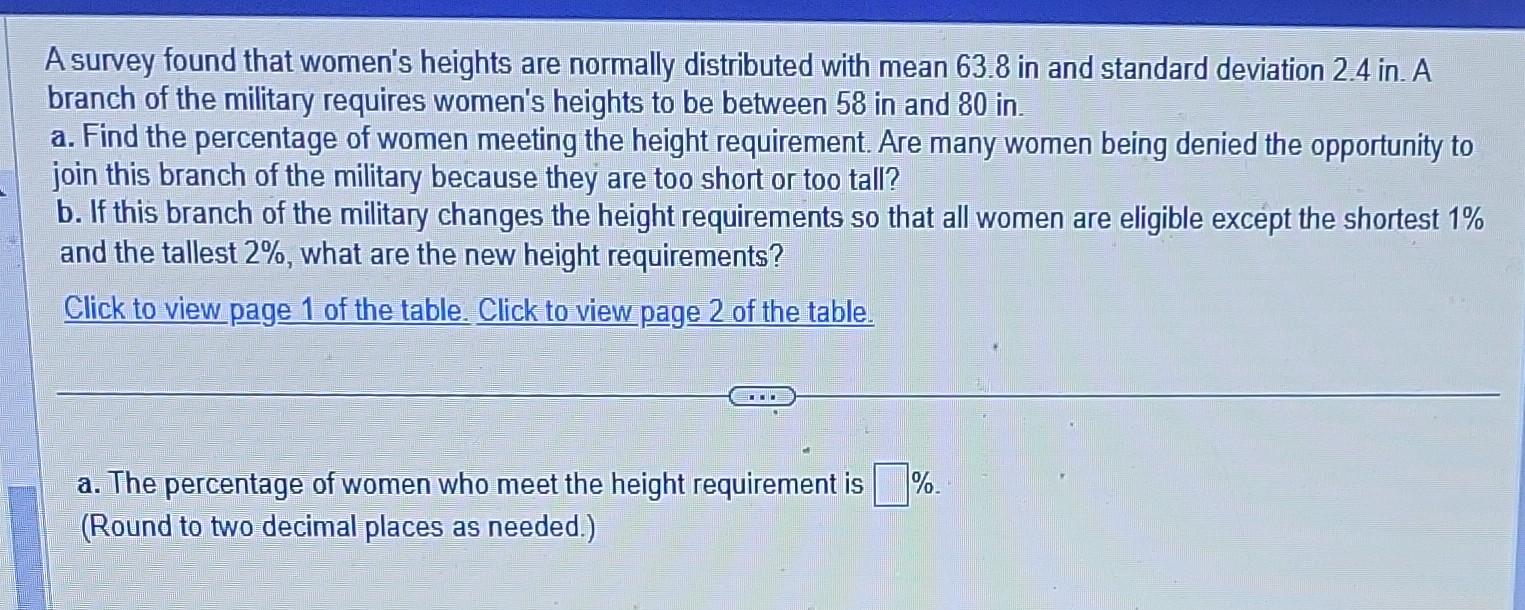
A survey found that women's heights are normally distributed with mean in and standard deviation in. A branch of the military requires women's heights to be between 58 in and 80 in. a. Find the percentage of women meeting the height requirement. Are many women being denied the opportunity to join this branch of the military because they are too short or too tall? b. If this branch of the military changes the height requirements so that all women are eligible except the shortest and the tallest , what are the new height requirements? Click to view page 1 of the table. Click to view page 2 of the table. a. The percentage of women who meet the height requirement is . (Round to two decimal places as needed.)
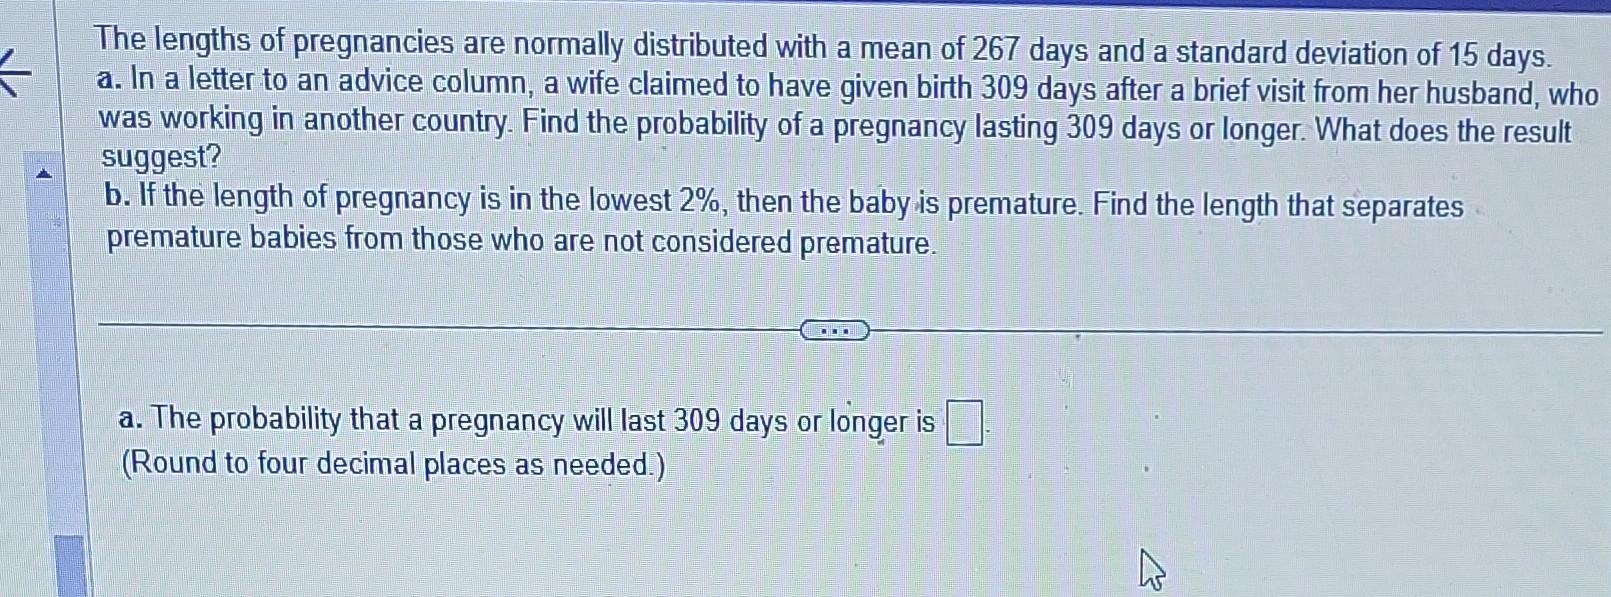
The lengths of pregnancies are normally distributed with a mean of 267 days and a standard deviation of 15 days. a. In a letter to an advice column, a wife claimed to have given birth 309 days after a brief visit from her husband, who was working in another country. Find the probability of a pregnancy lasting 309 days or longer. What does the result suggest? b. If the length of pregnancy is in the lowest , then the baby is premature. Find the length that separates premature babies from those who are not considered premature. a. The probability that a pregnancy will last 309 days or longer is (Round to four decimal places as needed.)
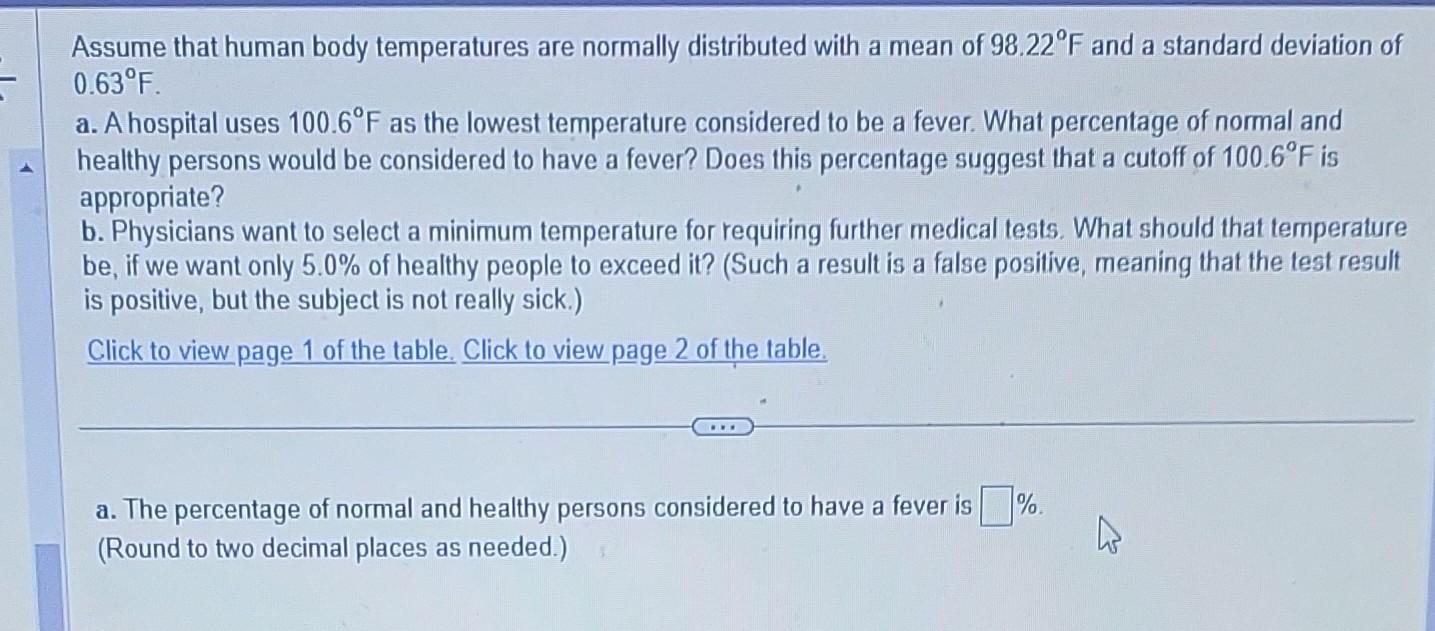
Assume that human body temperatures are normally distributed with a mean of and a standard deviation of a. A hospital uses as the lowest temperature considered to be a fever. What percentage of normal and healthy persons would be considered to have a fever? Does this percentage suggest that a cutoff of is appropriate? b. Physicians want to select a minimum temperature for requiring further medical tests. What should that temperature be, if we want only of healthy people to exceed it? (Such a result is a false positive, meaning that the test result is positive, but the subject is not really sick.) Click to view page 1 of the table. Click to view page 2 of the table. a. The percentage of normal and healthy persons considered to have a fever is (Round to two decimal places as needed.)
Expert Answer
Solution:-(1) From the given standard normal distribution graph with mean = 0 and standard deviation = 1It can be noted that, area underlying the grap