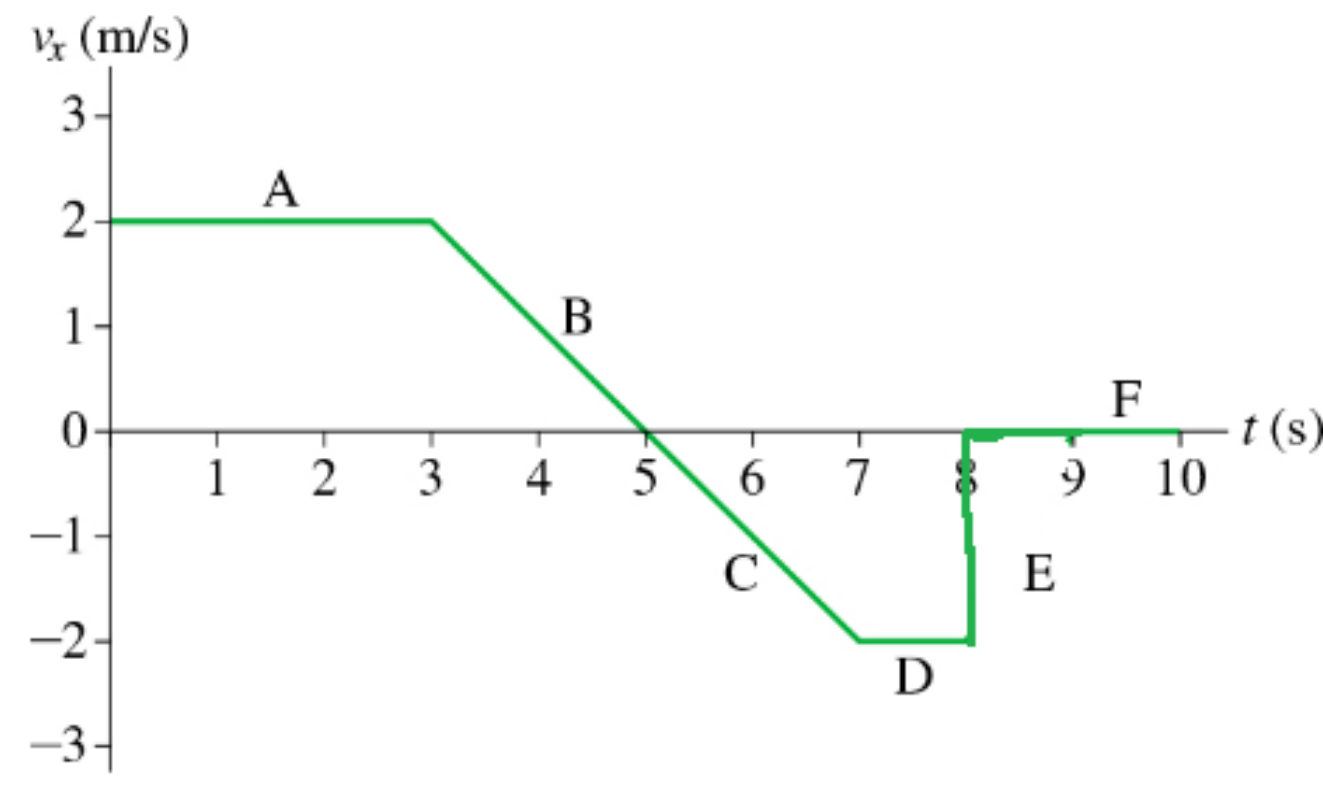
Figure below shows an object’s velocity vs time graph. Draw the position vs time graph. Assume x = 0 at t = 0.