Home /
Expert Answers /
Economics /
figure-a-below-depicts-the-demand-and-supply-of-japanese-yen-in-the-foreign-currency-exchange-mark-pa207
(Solved): Figure A below depicts the demand and supply of Japanese yen in the foreign currency exchange mark ...
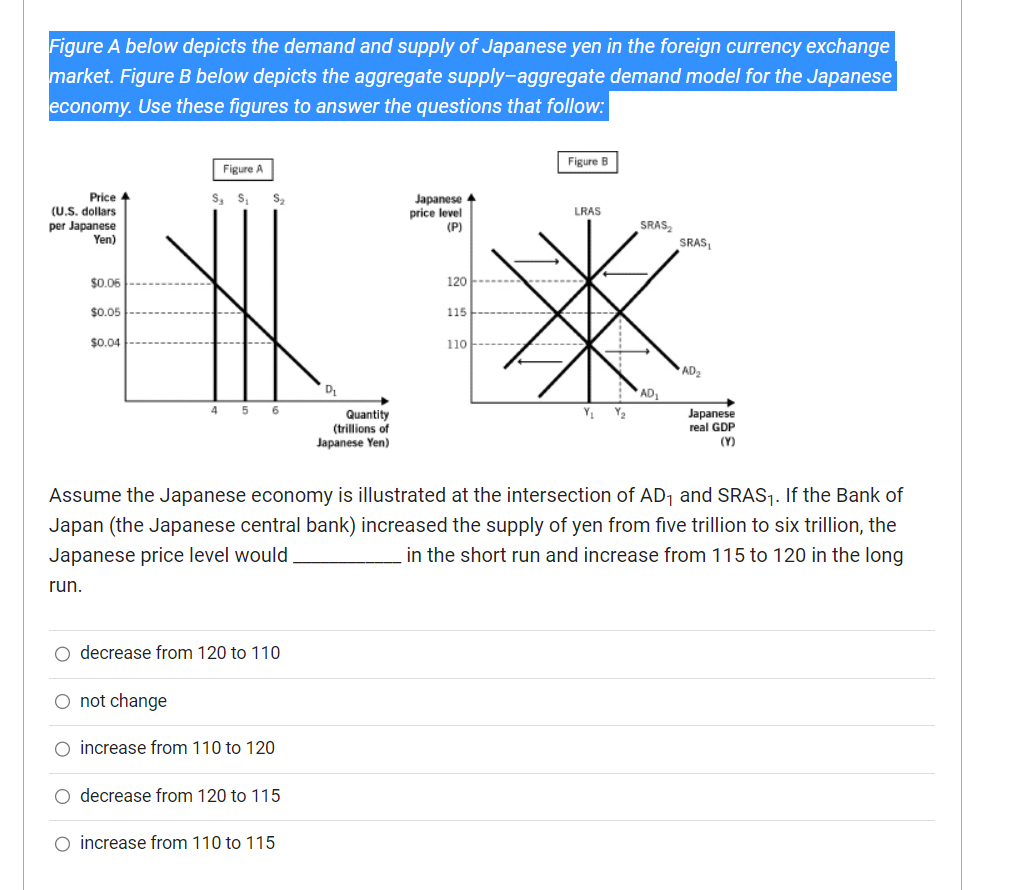
Figure A below depicts the demand and supply of Japanese yen in the foreign currency exchange market. Figure \( B \) below depicts the aggregate supply-aggregate demand model for the Japanese economy. Use these figures to answer the questions that follow: Assume the Japanese economy is illustrated at the intersection of \( A D_{1} \) and SRAS Japan (the Japanese central bank) increased the supply of yen from five trillion to six trillion, the Japanese price level would in the short run and increase from 115 to 120 in the long run. decrease from 120 to 110 not change increase from 110 to 120 decrease from 120 to 115 increase from 110 to 115
Expert Answer
Answer 2- Ans - (option 5) Increase from 110 to 115 Explanation - Increasing in maney supply will have expansionry impact. In short run it will shift the A