Home /
Expert Answers /
Earth Sciences /
figure-9-is-the-surface-weather-map-for-o0z-03-nov-2013-saturday-evening-at-map-time-both-st-pa178
(Solved): Figure 9 is the surface weather map for O0Z 03 NOV 2013, Saturday evening. At map time both st ...
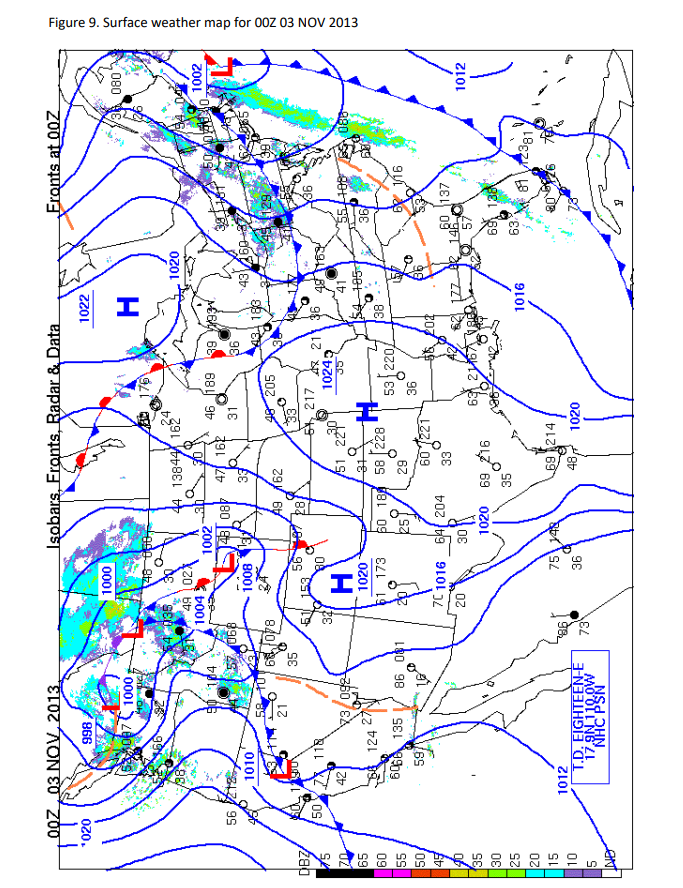
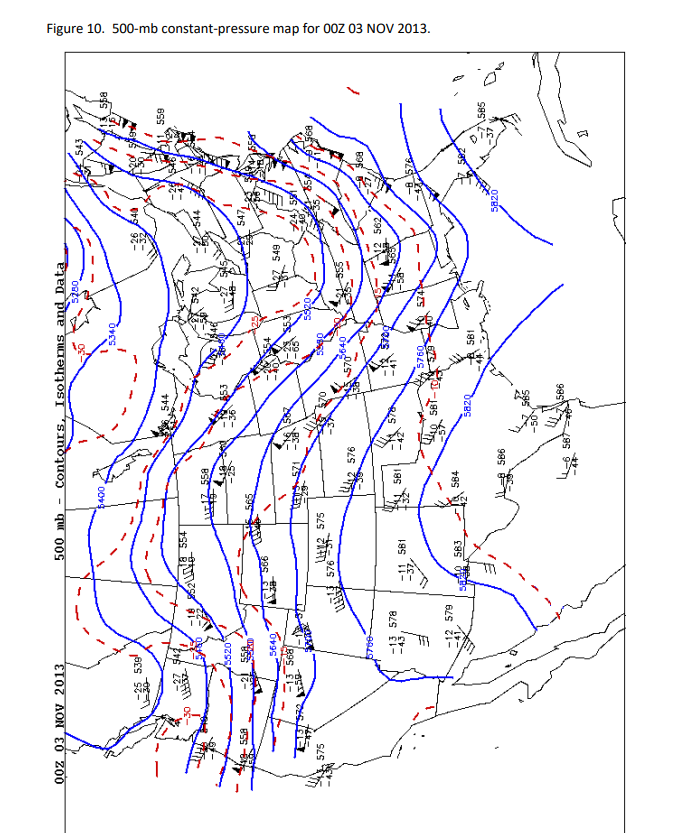
Figure 9 is the surface weather map for O0Z 03 NOV 2013, Saturday evening. At map time both storm systems were visible, one with a low-pressure center marked off the New England coast and one along the Washington State-British Columbia border. Between the storm systems was an elongated area of high pressure stretching across the southern Plains States through Ontario, Canada. 35. Wind directions at station models near isobar lines across the country were generally seen to flow [(parallel to surface isobars)(at angles across isobars)]. 36. Reported surface wind speeds across the coterminous U.S. were generally less than those at Spokane, Washington, which was three full feathers or knots. 37. Figure 10 is the 500-mb constant-pressure map for Saturday evening, NOV 2013, the same time as the Figure 9 surface map. The mid-tropospheric flow pattern shown by the contour lines on the 500-mb map, displayed [(a trough in the northwestern U.S.)(a ridge centered in the west-central U.S.)(a broad trough over the eastern U.S.)(all of these features)]. 38. Recall that the heights at which the radiosondes detect 500-mb of pressure are reported in the upper right position of the upper-air station models on the map. Also, the heights are plotted in tens of meters, so that a " 0 " needs to be added to the digits for the actual height. The height of the 500-mb pressure level plotted at Denver, in north-central Colorado, was [(5320)(5510)(5750)] m above sea level. 39. Compare the heights of the 500 -mb pressure surface from south to north on the map. As latitude increases (one moves poleward), the height of the 500-mb surface generally [(increases)(remains constant)(decreases)]. 40. The highest wind speeds plotted on the 500 -mb map were at Wallops Island, VA, Chatham, MA, and Yarmouth, Nova Scotia, where there were speeds of [(30)(60)(110)] kts generally from the southwest, much higher than surface wind speeds at the same locations.
Expert Answer
Figure 9 is the surface weather map for O0Z 03 NOV 2013, Saturday evening. At map time both storm sy...