Home /
Expert Answers /
Economics /
figure-9-22-the-following-diagram-shows-the-domestic-demand-and-domestic-supply-in-a-market-in-add-pa171
(Solved): Figure 9-22 The following diagram shows the domestic demand and domestic supply in a market. In add ...
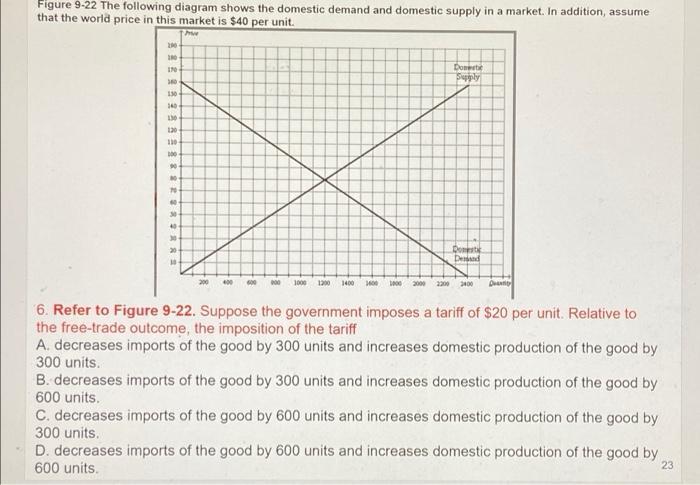
Figure 9-22 The following diagram shows the domestic demand and domestic supply in a market. In addition, assume that the world price in this market is $40 per unit. hve 200 170 Domestic Supply 360 130 140 130 120 110 100 90 NO 70 60 30 40 30 20 Domestic Dessand 10 400 1000 1200 1400 1600 1000 2000 2200 2400 Den 6. Refer to Figure 9-22. Suppose the government imposes a tariff of $20 per unit. Relative to the free-trade outcome, the imposition of the tariff A. decreases imports of the good by 300 units and increases domestic production of the good by 300 units. B. decreases imports of the good by 300 units and increases domestic production of the good by 600 units. C. decreases imports of the good by 600 units and increases domestic production of the good by 300 units. D. decreases imports of the good by 600 units and increases domestic production of the good by 600 units. 23
Expert Answer
C. decreases imports of the good by 600 units and increases domestic production of the good by 300 units. Explanation: C. decreases imports of the good by 600 units and increases domestic production of the good by 300 units. When the government imp