Home /
Expert Answers /
Physics /
figure-3-shows-the-vibrational-spectrum-and-different-vibrational-modes-for-a-pa406
(Solved): Figure 3 shows the vibrational spectrum and different vibrational modes for a ...
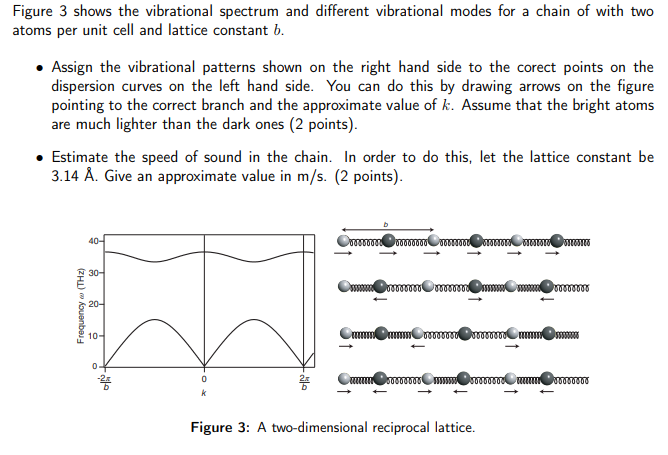
Figure 3 shows the vibrational spectrum and different vibrational modes for a chain of with two atoms per unit cell and lattice constant \( b \). - Assign the vibrational patterns shown on the right hand side to the corect points on the dispersion curves on the left hand side. You can do this by drawing arrows on the figure pointing to the correct branch and the approximate value of \( k \). Assume that the bright atoms are much lighter than the dark ones (2 points). - Estimate the speed of sound in the chain. In order to do this, let the lattice constant be \( 3.14 \AA \). Give an approximate value in \( \mathrm{m} / \mathrm{s} \). (2 points). Figure 3: A two-dimensional reciprocal lattice.
Expert Answer
THERE ARE WO TYPES OF MODES ACCOUSTIC AND OPTICAL The below figure depicts a long wavelength acoustic wave: All atoms in the unit cell move in-phase w