Home /
Expert Answers /
Economics /
figure-3-11-the-graph-below-represents-the-various-combinations-of-ham-and-cheese-in-pounds-pa718
(Solved): Figure \( 3-11 \) The graph below represents the various combinations of ham and cheese (in pounds) ...
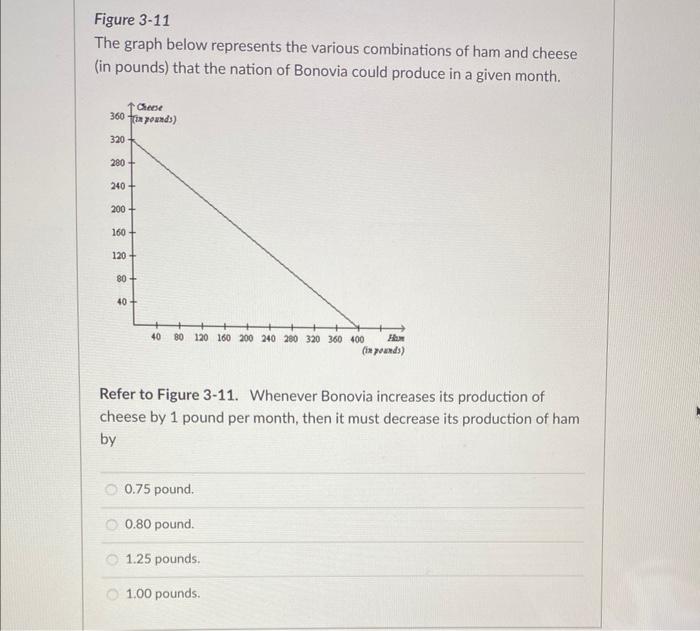
Figure \( 3-11 \) The graph below represents the various combinations of ham and cheese (in pounds) that the nation of Bonovia could produce in a given month. Refer to Figure 3-11. Whenever Bonovia increases its production of cheese by 1 pound per month, then it must decrease its production of ham by \( 0.75 \) pound. \( 0.80 \) pound. \( 1.25 \) pounds. \( 1.00 \) pounds.