Home /
Expert Answers /
Earth Sciences /
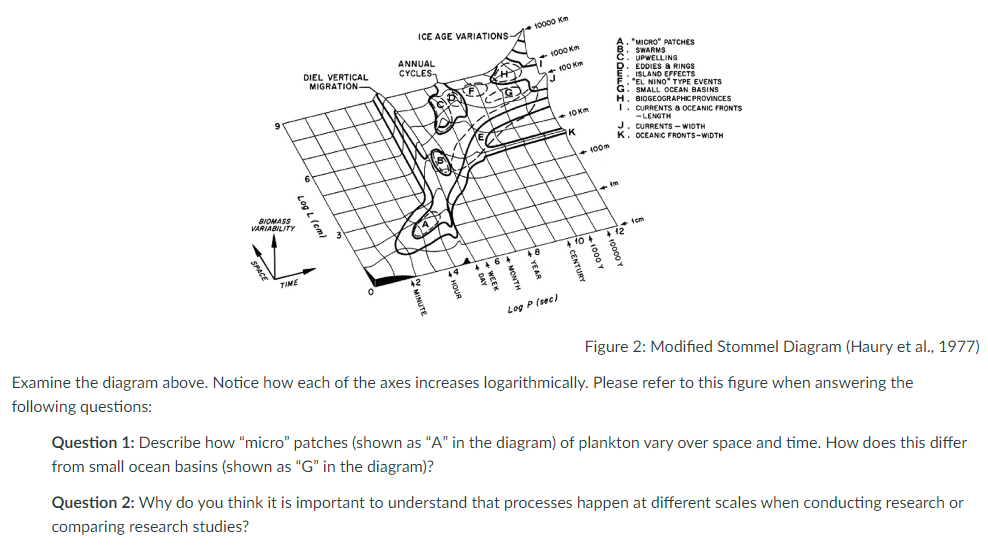
figure-2-modified-stommel-diagram-haury-et-al-1977-examine-the-diagram-above-notice-how-each-pa214
(Solved): Figure 2: Modified Stommel Diagram (Haury et al., 1977) Examine the diagram above. Notice how each ...
Figure 2: Modified Stommel Diagram (Haury et al., 1977) Examine the diagram above. Notice how each of the axes increases logarithmically. Please refer to this figure when answering the ollowing questions: Question 1: Describe how "micro" patches (shown as " \( \mathrm{A} \) " in the diagram) of plankton vary over space and time. How does this differ from small ocean basins (shown as " \( \mathrm{G} \) " in the diagram)? Question 2: Why do you think it is important to understand that processes happen at different scales when conducting research or comparing research studies?
Expert Answer
Answer 1: "Micro" patches (A) of plankton are small, localized areas of high plankton concentration that can v
