Home /
Expert Answers /
Chemical Engineering /
figure-2-b-shows-a-selected-area-diffraction-pattern-for-this-sample-why-are-they-rings-and-not-pa300
(Solved): Figure 2(b) shows a selected area diffraction pattern for this sample. Why are they rings and not ...
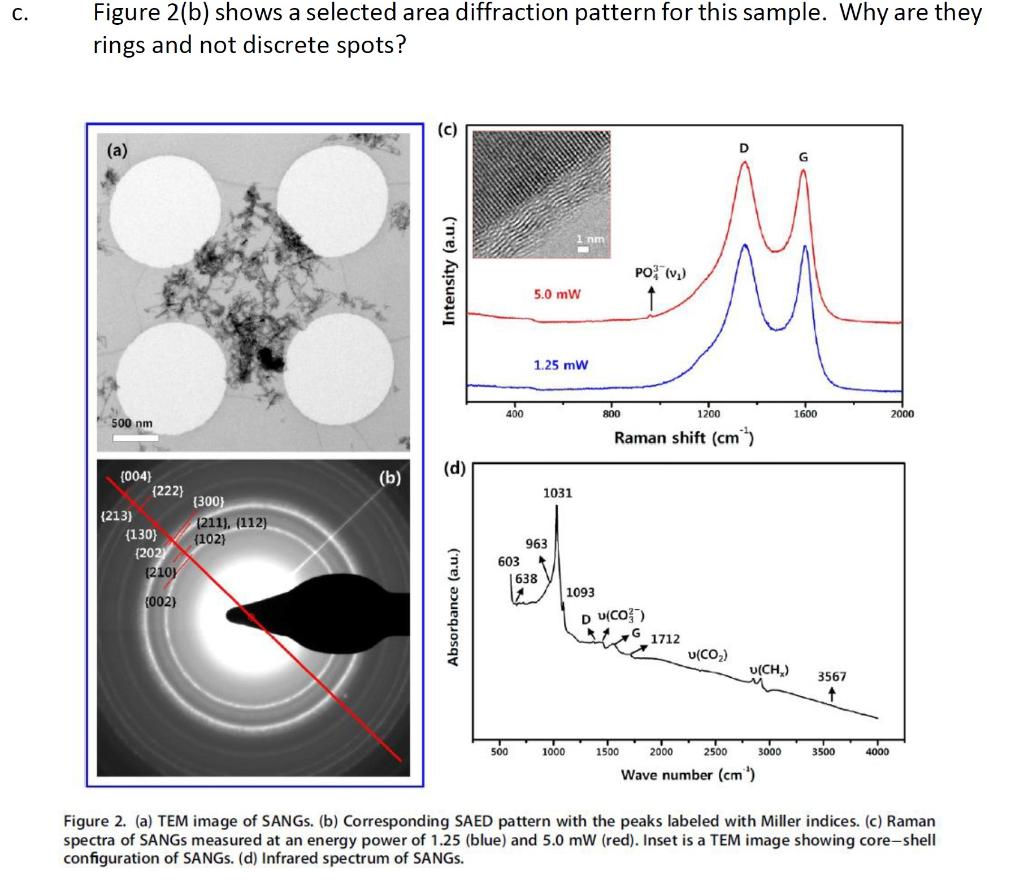
Figure 2(b) shows a selected area diffraction pattern for this sample. Why are they rings and not discrete spots? spectra of SANGs measured at an energy power of \( 1.25 \) (blue) and \( 5.0 \mathrm{~mW} \) (red). Inset is a TEM image showing core-shell configuration of SANGs. (d) Infrared spectrum of SANGs.