Home /
Expert Answers /
Physics /
figure-1-shows-the-fringes-observed-in-a-double-slit-interference-experiment-when-the-two-slits-pa621
(Solved): (Figure 1) shows the fringes observed in a double-slit interference experiment when the two slits ...
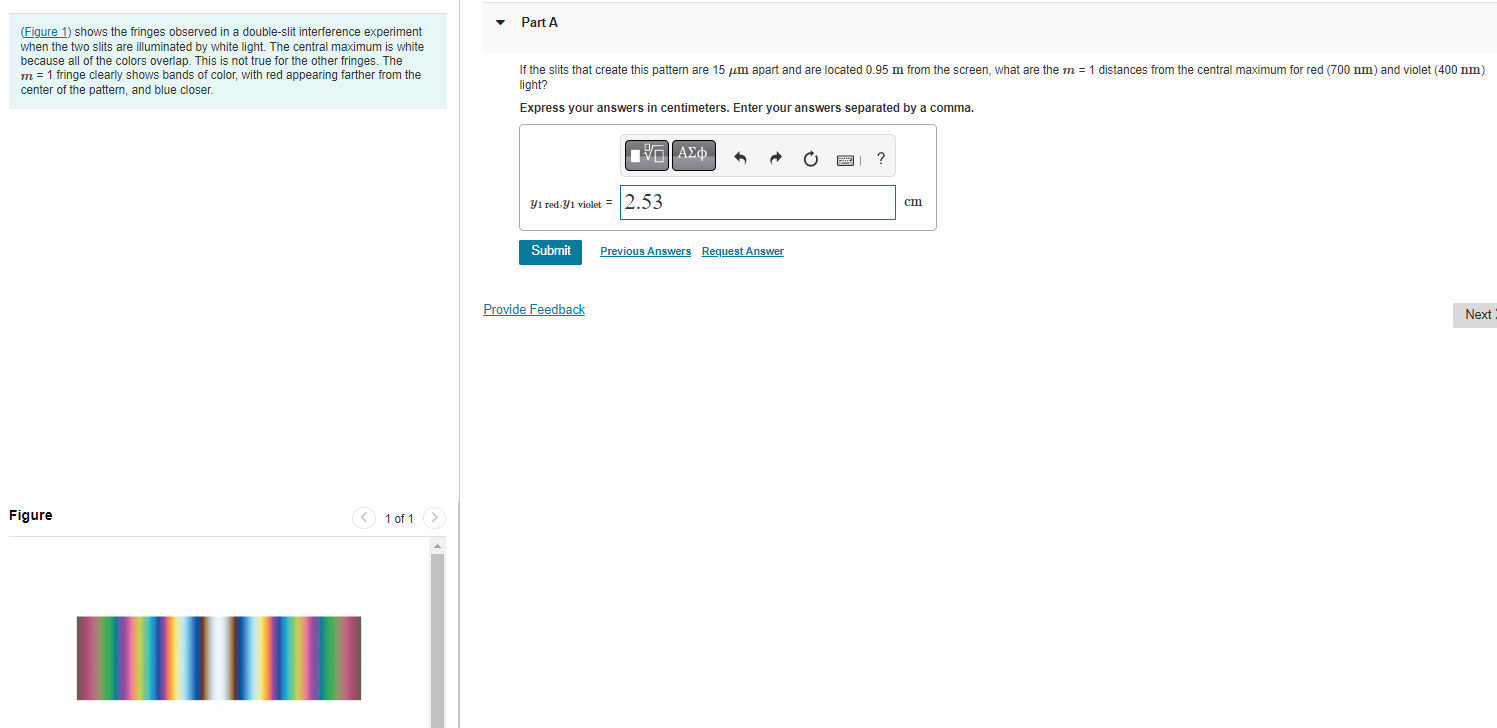
(Figure 1) shows the fringes observed in a double-slit interference experiment when the two slits are illuminated by white light. The central maximum is white because all of the colors overlap. This is not true for the other fringes. The \( m=1 \) fringe clearly shows bands of color, with red appearing farther from the center of the pattern, and blue closer. If the slits that create this pattern are \( 15 \mu \mathrm{m} \) apart and are located \( 0.95 \mathrm{~m} \) from the screen, what are the \( \mathrm{m}=1 \) distances from the central maximum for red (700 nm) and violet (400 \( \mathrm{nm} \) ) light? Express your answers in centimeters. Enter your answers separated by a comma.