Home /
Expert Answers /
Physics /
figure-1-is-a-graph-of-ex-figure-what-is-the-potential-difference-between-xi-2-0m-and-xf-pa151
Expert Answer
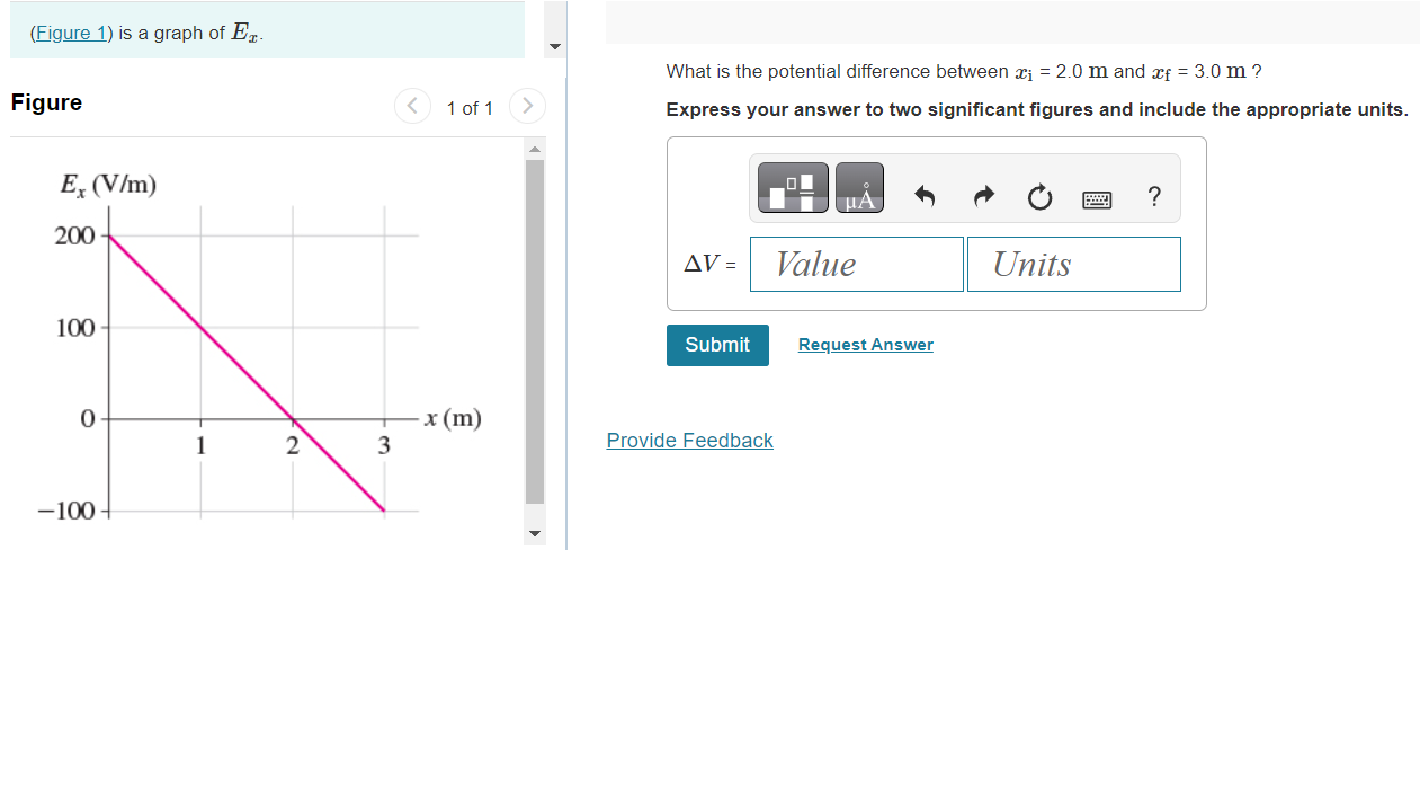
Concept: the slope of the potential-position graph is the electric field: