Home /
Expert Answers /
Physics /
example-1-7-interpreting-a-position-graph-the-graph-in-figure-1-21-a-represents-the-mo-pa918
(Solved): EXAMPLE \( 1.7 \) Interpreting a position graph The graph in FiGURE \( 1.21 \) a represents the mo ...
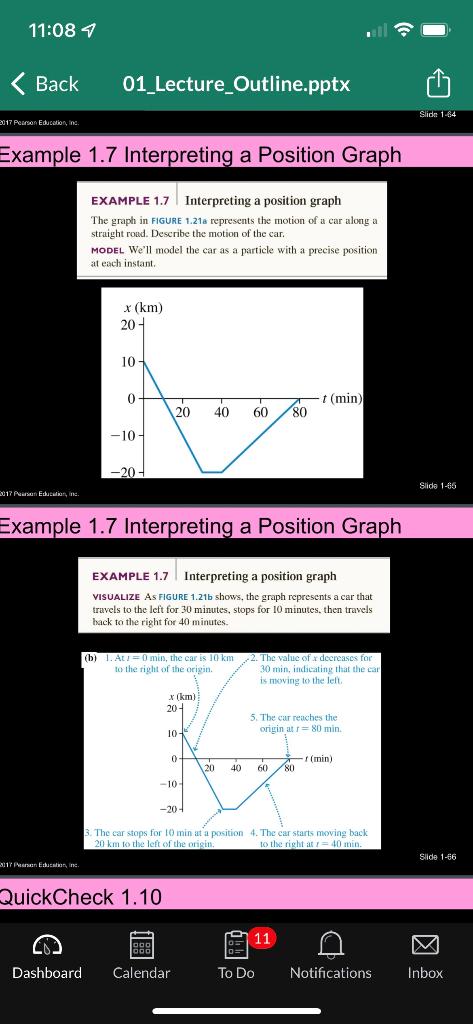
EXAMPLE \( 1.7 \) Interpreting a position graph The graph in FiGURE \( 1.21 \) a represents the motion of a car along a straight rowd. Describe the motion of the car. MODEL We'll model the car as a particle with a precise position at each instant. Example \( 1.7 \) Interpreting a Position Graph \begin{tabular}{|l|l} \hline EXAMPLE \( 1.7 \) & Interpreting a position graph \end{tabular} VISUALIZE AS FIGURE 1.21b shows, the graph represents a car that travels to the left for 30 minutes, stops for 10 minutes. then travels back to the right for \( 40 \mathrm{~m} \) inutes. (b) \( 1 . \mathrm{A} t \mathrm{l}=\mathrm{I} \) for' to the t ie càr 3. The car stops for 10 min at a position 4. The car starts moving back \( 20 \mathrm{~km} \) fo the left of the origin; to the right at \( t=40 \) min.
Homework: 1) Draw a motion diagram for the example problem \( 1.7 \) (slides #65-66). Calculate the velocity of the car for \( \mathrm{t}<30 \mathrm{~min} \), \( 30 \mathrm{~min}40 \mathrm{~min} \).(Pay attention to the signs)

