Home /
Expert Answers /
Statistics and Probability /
e-construct-a-95-bootstrap-confidence-interval-using-the-original-sample-statistic-and-the-pm-pa892
(Solved): e) Construct a 95% bootstrap confidence interval using the original sample statistic and the \pm ...
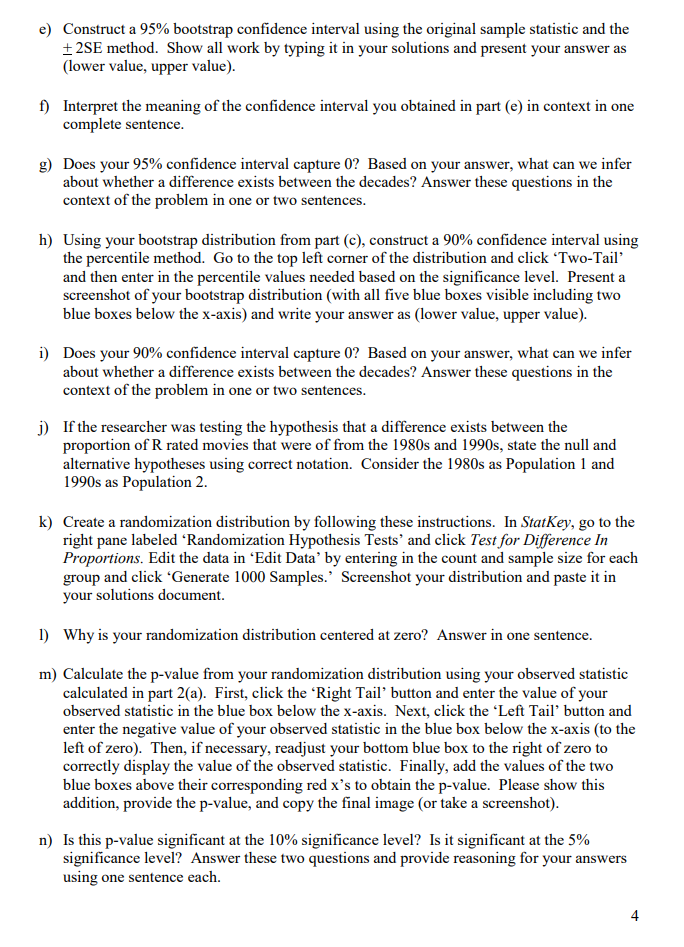
e) Construct a bootstrap confidence interval using the original sample statistic and the \pm 2 SE method. Show all work by typing it in your solutions and present your answer as (lower value, upper value). f) Interpret the meaning of the confidence interval you obtained in part (e) in context in one complete sentence. g) Does your confidence interval capture 0 ? Based on your answer, what can we infer about whether a difference exists between the decades? Answer these questions in the context of the problem in one or two sentences. h) Using your bootstrap distribution from part (c), construct a confidence interval using the percentile method. Go to the top left corner of the distribution and click 'Two-Tail' and then enter in the percentile values needed based on the significance level. Present a screenshot of your bootstrap distribution (with all five blue boxes visible including two blue boxes below the -axis) and write your answer as (lower value, upper value). i) Does your confidence interval capture 0 ? Based on your answer, what can we infer about whether a difference exists between the decades? Answer these questions in the context of the problem in one or two sentences. j) If the researcher was testing the hypothesis that a difference exists between the proportion of R rated movies that were of from the 1980s and 1990s, state the null and alternative hypotheses using correct notation. Consider the 1980s as Population 1 and 1990 s as Population 2. k) Create a randomization distribution by following these instructions. In StatKey, go to the right pane labeled 'Randomization Hypothesis Tests' and click Test for Difference In Proportions. Edit the data in 'Edit Data' by entering in the count and sample size for each group and click 'Generate 1000 Samples.' Screenshot your distribution and paste it in your solutions document. 1) Why is your randomization distribution centered at zero? Answer in one sentence. m) Calculate the p-value from your randomization distribution using your observed statistic calculated in part 2(a). First, click the 'Right Tail' button and enter the value of your observed statistic in the blue box below the -axis. Next, click the 'Left Tail' button and enter the negative value of your observed statistic in the blue box below the -axis (to the left of zero). Then, if necessary, readjust your bottom blue box to the right of zero to correctly display the value of the observed statistic. Finally, add the values of the two blue boxes above their corresponding red x's to obtain the p-value. Please show this addition, provide the p-value, and copy the final image (or take a screenshot). n) Is this p-value significant at the significance level? Is it significant at the significance level? Answer these two questions and provide reasoning for your answers using one sentence each. 4
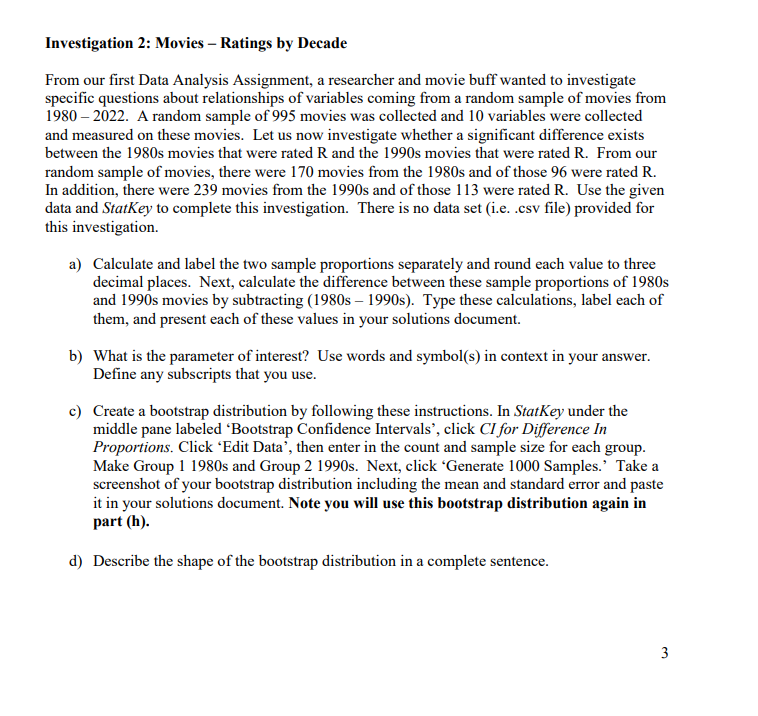
Investigation 2: Movies - Ratings by Decade From our first Data Analysis Assignment, a researcher and movie buff wanted to investigate specific questions about relationships of variables coming from a random sample of movies from 1980 - 2022. A random sample of 995 movies was collected and 10 variables were collected and measured on these movies. Let us now investigate whether a significant difference exists between the 1980s movies that were rated R and the 1990s movies that were rated R. From our random sample of movies, there were 170 movies from the and of those 96 were rated . In addition, there were 239 movies from the 1990 s and of those 113 were rated R. Use the given data and StatKey to complete this investigation. There is no data set (i.e. .csv file) provided for this investigation. a) Calculate and label the two sample proportions separately and round each value to three decimal places. Next, calculate the difference between these sample proportions of and 1990 s movies by subtracting (1980s . Type these calculations, label each of them, and present each of these values in your solutions document. b) What is the parameter of interest? Use words and symbol(s) in context in your answer. Define any subscripts that you use. c) Create a bootstrap distribution by following these instructions. In StatKey under the middle pane labeled 'Bootstrap Confidence Intervals', click CI for Difference In Proportions. Click 'Edit Data', then enter in the count and sample size for each group. Make Group 1 1980s and Group 2 1990s. Next, click 'Generate 1000 Samples.' Take a screenshot of your bootstrap distribution including the mean and standard error and paste it in your solutions document. Note you will use this bootstrap distribution again in part (h). d) Describe the shape of the bootstrap distribution in a complete sentence.
o) Compare your responses to these two questions asked in part (n) to your answers to parts (g) and (i) in two complete sentences.