Home /
Expert Answers /
Statistics and Probability /
e-calculate-the-degrees-of-freedomf-what-is-the-correct-p-value-circle-the-correctanswer-g-circl-pa826
(Solved): e. Calculate the degrees of freedomf. What is the correct p-value. Circle the correctanswer.g. Circl ...
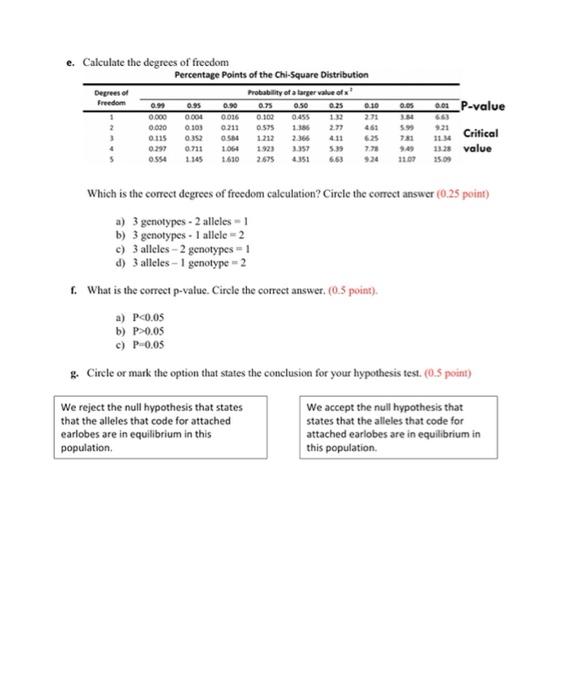
e. Calculate the degrees of freedom
f. What is the correct p-value. Circle the correct
answer.
g. Circle or mark the option that states the
conclusion for your hypothesis test.
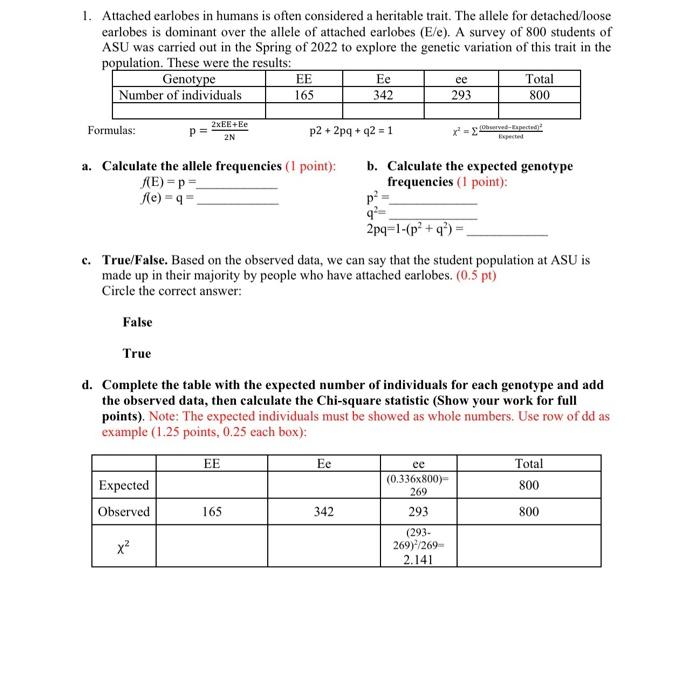
1. Attached earlobes in humans is often considered a heritable trait. The allele for detached/loose earlobes is dominant over the allele of attached earlobes (E/e). A survey of 800 students of ASU was carried out in the Spring of 2022 to explore the genetic variation of this trait in the ponulation. These were the results: Formulas: \[ \mathrm{p}=\frac{2 \mathrm{xEE}+\mathrm{Ee}}{2 \mathrm{~N}} \] \[ p 2+2 p q+q 2=1 \] \( \mathrm{~ a . ~ C a l c u l a t e ~ t h e ~ a l l e l e ~ f r e q u e n c i e s ~ (} \) b. Calculate the expected genotype \( f(\mathrm{E})=\mathrm{p}= \) frequencies ( 1 point): \( f(\mathrm{e})=\mathrm{q}= \) \( \mathrm{p}^{2}= \) \( q^{2}= \) \( 2 p q=1-\left(p^{2}+q^{2}\right)= \) c. True/False. Based on the observed data, we can say that the student population at ASU is made up in their majority by people who have attached earlobes. \( (0.5 \mathrm{pt}) \) Circle the correct answer: False True d. Complete the table with the expected number of individuals for each genotype and add the observed data, then calculate the Chi-square statistic (Show your work for full points). Note: The expected individuals must be showed as whole numbers. Use row of dd as example ( \( 1.25 \) points, \( 0.25 \) each box):
e. Calculate the degrees of freedom Percentage Points of the Chi-Sauare Distribution Which is the correct degrees of freedom calculation? Circle the correct answer \( (0.25 \) point) a) 3 genotypes \( -2 \) alleles \( =1 \) b) 3 genotypes \( -1 \) allele \( =2 \) c) 3 alleles \( -2 \) genotypes \( =1 \) d) 3 alleles \( -1 \) genotype \( =2 \) f. What is the correct \( \mathrm{p} \)-value. Circle the correct answer, (0.5 point). a) \( \operatorname{PC0.05} \) b) \( P>0.05 \) c) \( \mathrm{P}=0.05 \) g. Circle or mark the option that states the conclusion for your hypothesis test. (0.5 point) \begin{tabular}{|l|l|l|} \hline We reject the null hypothesis that states & We accept the null hypothesis that \\ that the alleles that code for attached \\ earlobes are in equilibrium in this & states that the alleles that code for \\ population. & attached earlobes are in equilibrium in \\ this population. \end{tabular}
Expert Answer
This can be correctly filled as follows- While performing the chi-square test, we compared the obse