Home /
Expert Answers /
Statistics and Probability /
draw-a-side-by-side-stem-and-leaf-plot-for-the-following-late-december-temperature-data-the-data-pa205
(Solved): Draw a side-by-side stem and leaf plot for the following late December Temperature data. The data ...
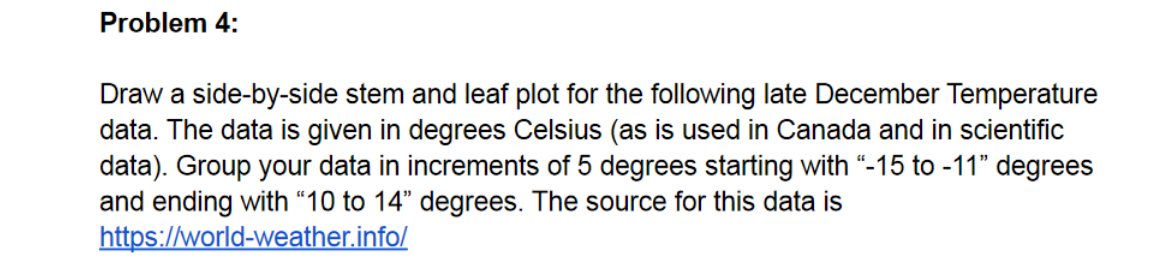
Draw a side-by-side stem and leaf plot for the following late December Temperature data. The data is given in degrees Celsius (as is used in Canada and in scientific data). Group your data in increments of 5 degrees starting with "- 15 to " degrees and ending with " 10 to 14 " degrees. The source for this data is https://world-weather.info/
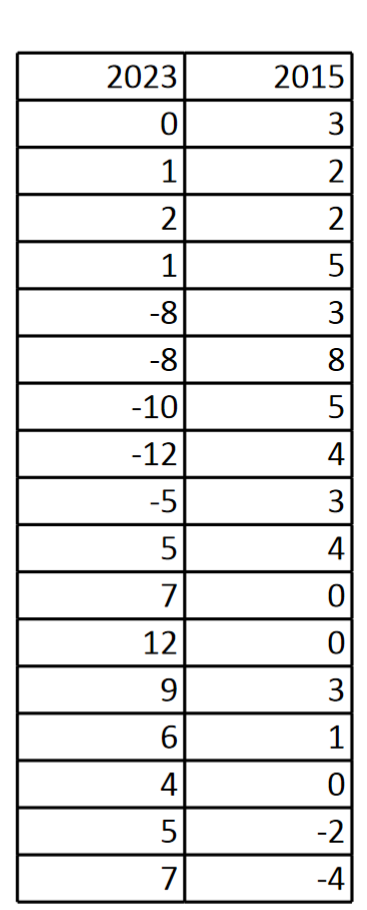
\begin{tabular}{|r|r|} \hline 2023 & 2015 \\ \hline 0 & 3 \\ \hline 1 & 2 \\ \hline 2 & 2 \\ \hline 1 & 5 \\ \hline & 3 \\ \hline & 8 \\ \hline & 5 \\ \hline & 4 \\ \hline & 3 \\ \hline 5 & 4 \\ \hline 7 & 0 \\ \hline 12 & 0 \\ \hline 9 & 3 \\ \hline 6 & 1 \\ \hline 4 & 0 \\ \hline 5 & \\ \hline 7 & \\ \hline \end{tabular}
Expert Answer
The stem and the leaf plot of the data for the year 2023 a