Home /
Expert Answers /
Economics /
draw-a-graph-to-explain-as-well-a-constant-cost-perfectly-competitive-market-is-in-long-run-equilibr-pa639
(Solved): Draw a graph to explain as well A constant cost perfectly competitive market is in long run equilibr ...

Draw a graph to explain as well
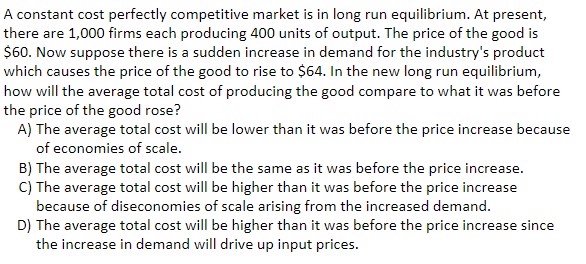
A constant cost perfectly competitive market is in long run equilibrium. At present, there are 1,000 firms each producing 400 units of output. The price of the good is . Now suppose there is a sudden increase in demand for the industry's product which causes the price of the good to rise to . In the new long run equilibrium, how will the average total cost of producing the good compare to what it was before the price of the good rose? A) The average total cost will be lower than it was before the price increase because of economies of scale. B) The average total cost will be the same as it was before the price increase. C) The average total cost will be higher than it was before the price increase because of diseconomies of scale arising from the increased demand. D) The average total cost will be higher than it was before the price increase since the increase in demand will drive up input prices.