Home /
Expert Answers /
Statistics and Probability /
directions-fill-in-the-answer-to-the-questions-posed-below-attach-the-specified-printouts-where-i-pa876
(Solved): Directions: Fill in the answer to the questions posed below. Attach the specified printouts where i ...
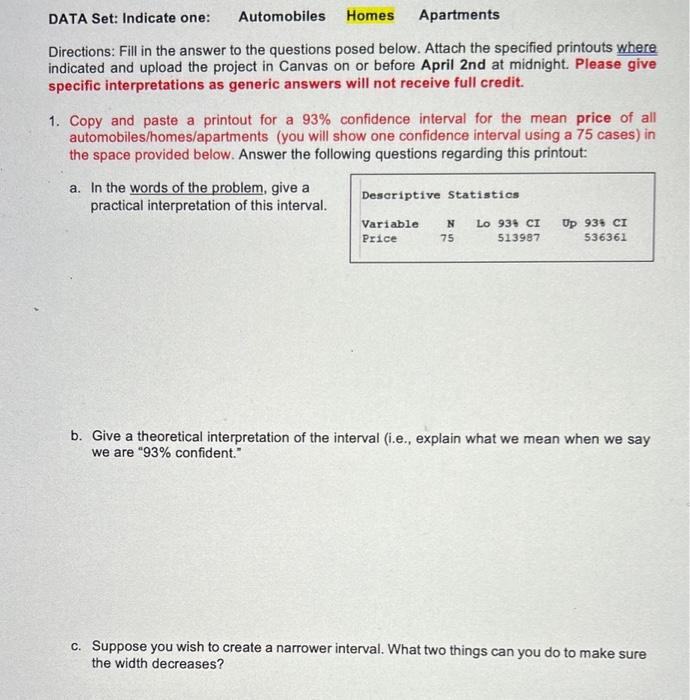
Directions: Fill in the answer to the questions posed below. Attach the specified printouts where indicated and upload the project in Canvas on or before April 2 nd at midnight. Please give specific interpretations as generic answers will not receive full credit. 1. Copy and paste a printout for a confidence interval for the mean price of all automobiles/homes/apartments (you will show one confidence interval using a 75 cases) in the space provided below. Answer the following questions regarding this printout: a. In the words of the problem, give a practical interpretation of this interval. Descriptive Statistics b. Give a theoretical interpretation of the interval (i.e., explain what we mean when we say we are "93\% confident." c. Suppose you wish to create a narrower interval. What two things can you do to make sure the width decreases?
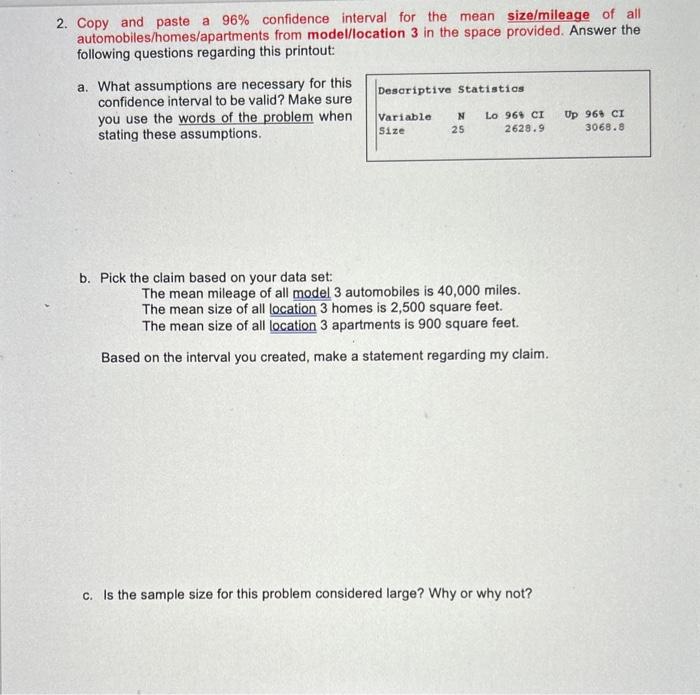
2. Copy and paste a confidence interval for the mean size/mileage of all automobiles/homes/apartments from model/location 3 in the space provided. Answer the following questions regarding this printout: a. What assumptions are necessary for this confidence interval to be valid? Make sure you use the words of the problem when stating these assumptions. b. Pick the claim based on your data set: The mean mileage of all model 3 automobiles is 40,000 miles. The mean size of all location 3 homes is 2,500 square feet. The mean size of all location 3 apartments is 900 square feet. Based on the interval you created, make a statement regarding my claim. c. Is the sample size for this problem considered large? Why or why not?
b. Is the sample size for this problem considered large? Why or why not? c. What assumption(s) is/are necessary for this confidence interval to be valid? Make sure you use the words of the problem when stating these assumptions.
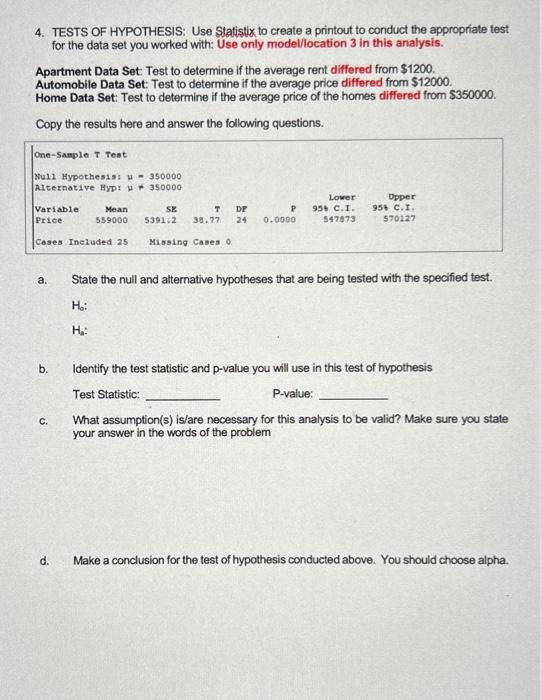
4. TESTS OF HYPOTHESIS: Use Statistix to create a printout to conduct the appropriate test for the data set you worked with: Use only model/location 3 in this analysis. Apartment Data Set. Test to determine if the average rent differed from . Automobile Data Set: Test to determine if the average price differed from . Home Data Set: Test to determine if the average price of the homes differed from . Copy the results here and answer the following questions. a. State the null and alternative hypotheses that are being tested with the specified test. b. Identify the test statistic and p-value you will use in this test of hypothesis Test Statistic: P-value: c. What assumption(s) is/are necessary for this analysis to be valid? Make sure you state your answer in the words of the problem d. Make a conclusion for the test of hypothesis conducted above. You should choose alpha.
Expert Answer
a. Here is the printout for a 93%confidence interval for the mean price of all automobiles/homes/apartments:Descriptive StatisticsVariable: PriceN=75L