Home /
Expert Answers /
Operations Management /
determine-the-c-chart-two-sigma-upper-and-lower-control-limits-for-this-process-is-the-process-in-pa146
(Solved): Determine the c-chart two-sigma upper and lower control limits for this process. Is the process in ...
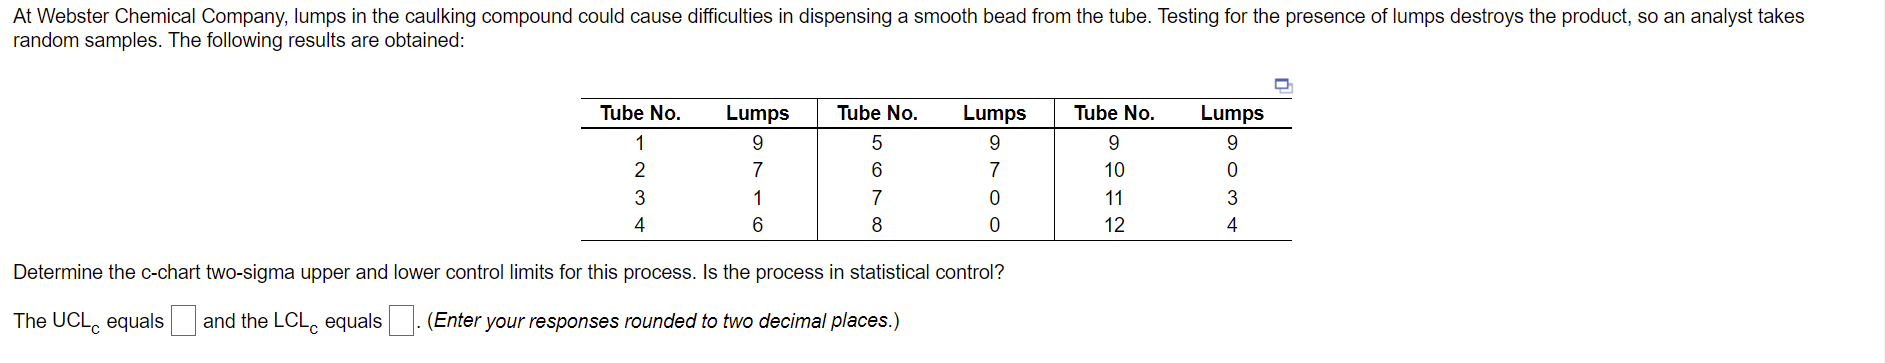
Determine the c-chart two-sigma upper and lower control limits for this process. Is the process in statistical control? The \( \mathrm{UCL}_{\mathrm{C}} \) equals and the \( \mathrm{LCL}_{\mathrm{C}} \) equals (Enter your responses rounded to two decimal places.)
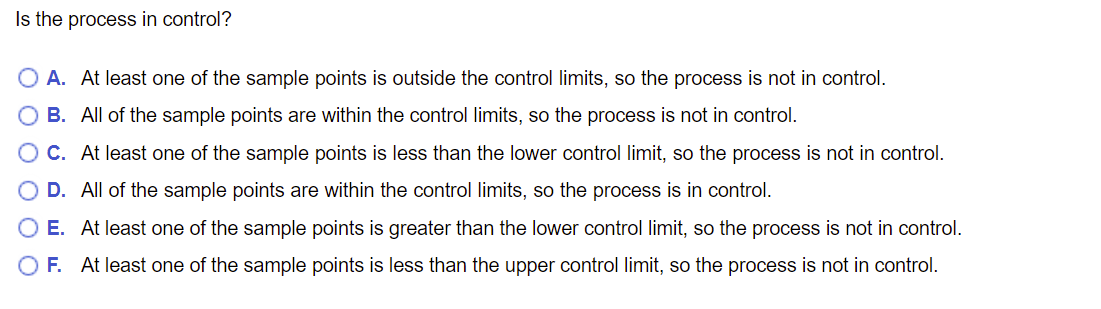
Is the process in control? A. At least one of the sample points is outside the control limits, so the process is not in control. B. All of the sample points are within the control limits, so the process is not in control. C. At least one of the sample points is less than the lower control limit, so the process is not in control. D. All of the sample points are within the control limits, so the process is in control. E. At least one of the sample points is greater than the lower control limit, so the process is not in control. F. At least one of the sample points is less than the upper control limit, so the process is not in control.
Expert Answer
The two-sigma Control limits for the c-chart are given by For the given case; Thus, the two-sigma UCLc and LCLc will be Hence, UCLc=8.87 LCLc=0.30 In a control chart if all sample point falls within the upper or lower control limits then the process