Home /
Expert Answers /
Finance /
david-owns-a-two-stock-portfolio-that-invests-in-happy-dog-soap-company-hds-and-black-sheep-broad-pa941
(Solved): David owns a two-stock portfolio that invests in Happy Dog Soap Company (HDS) and Black Sheep Broad ...
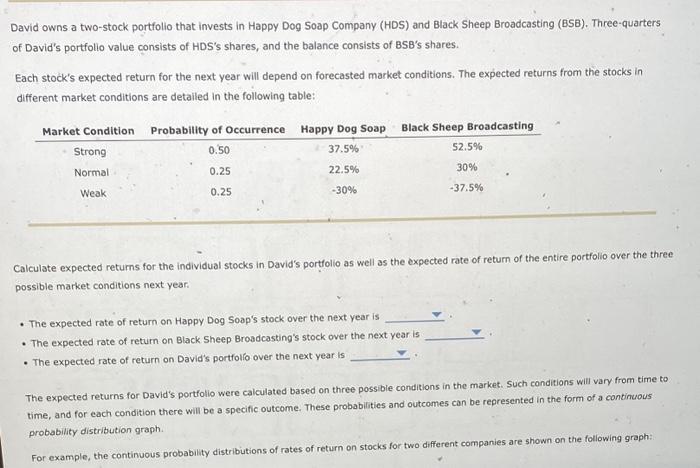
David owns a two-stock portfolio that invests in Happy Dog Soap Company (HDS) and Black Sheep Broadcasting (BSB). Three-quarters of David's portfolio value consists of HDS's shares, and the balance consists of BSB's shares. Each stock's expected return for the next year will depend on forecasted market conditions. The expected returns from the stocks in different market conditions are detailed in the following table: Calculate expected returns for the individual stocks in David's portfolio as well as the expected rate of return of the entire portfolio over the three possible market conditions next year. - The expected rate of return on Happy Dog Soap's stock over the next year is - The expected rate of return on Black Sheep Broadcasting's stock over the next year is - The expected rate of return on David's portfollo over the next year is The expected returns for David's portfolio were calculated based on three possible conditions in the market. Such conditions will vary from time to time, and for each condition there will be a specific outcome. These probabilities and outcomes can be represented in the form of a cantinuous probability distribution graph. For example, the continuous probability distributions of rates of return on stocks for two different companies are shown on the following graph:
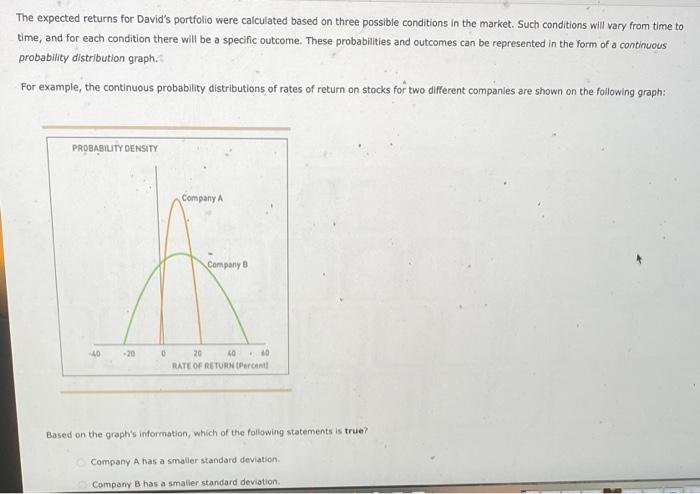
The expected returns for David's portfolio were calculated based on three possible conditions in the market. Such conditions will vary from time to time, and for each condition there will be a specific outcome. These probabilities and outcomes can be represented in the form of a continuous probability distribution graph. For example, the continuous probability distributions of rates of return on stocks for two different companies are shown on the following graph: Based on the graph's information, which of the following statements is true? Company A has a smaller standard deviation. Company B has a smalier standard deviation.
Expert Answer
Computation of expected return of HDS, BSB, and Portfolio, shown in below sheet: A1 B C D E 2 Market Condition Probability HDS BSB 3 Strong 0.