Home /
Expert Answers /
Statistics and Probability /
data-table-critical-values-for-normal-probability-plots-c-the-critical-value-is-round-to-pa209
(Solved): Data Table Critical Values for Normal Probability Plots (c) The critical value is (Round to ...
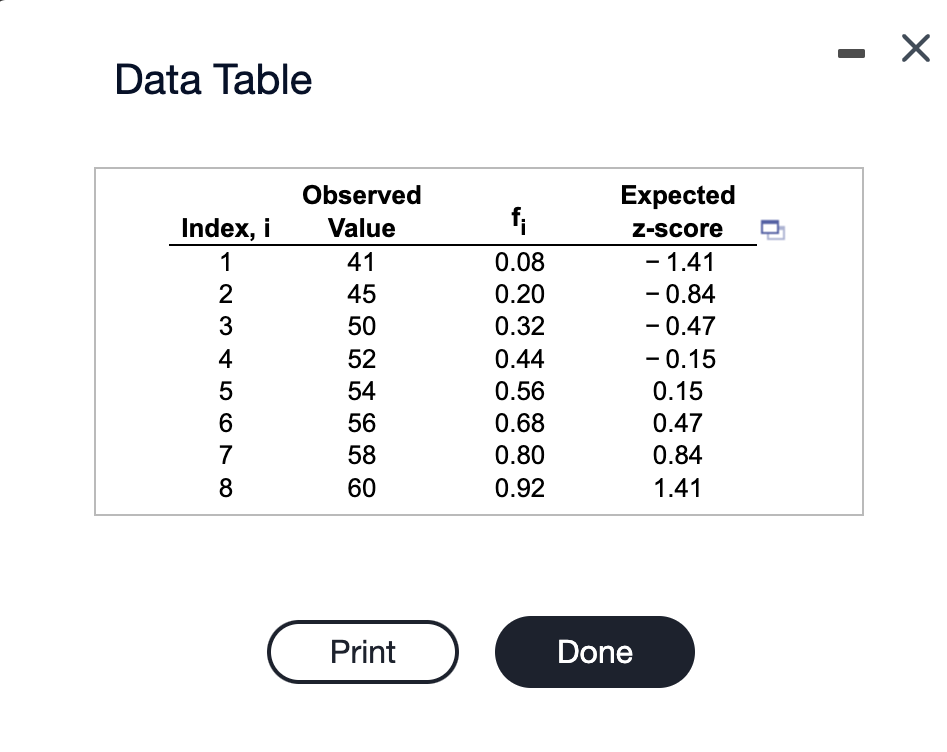
Data Table
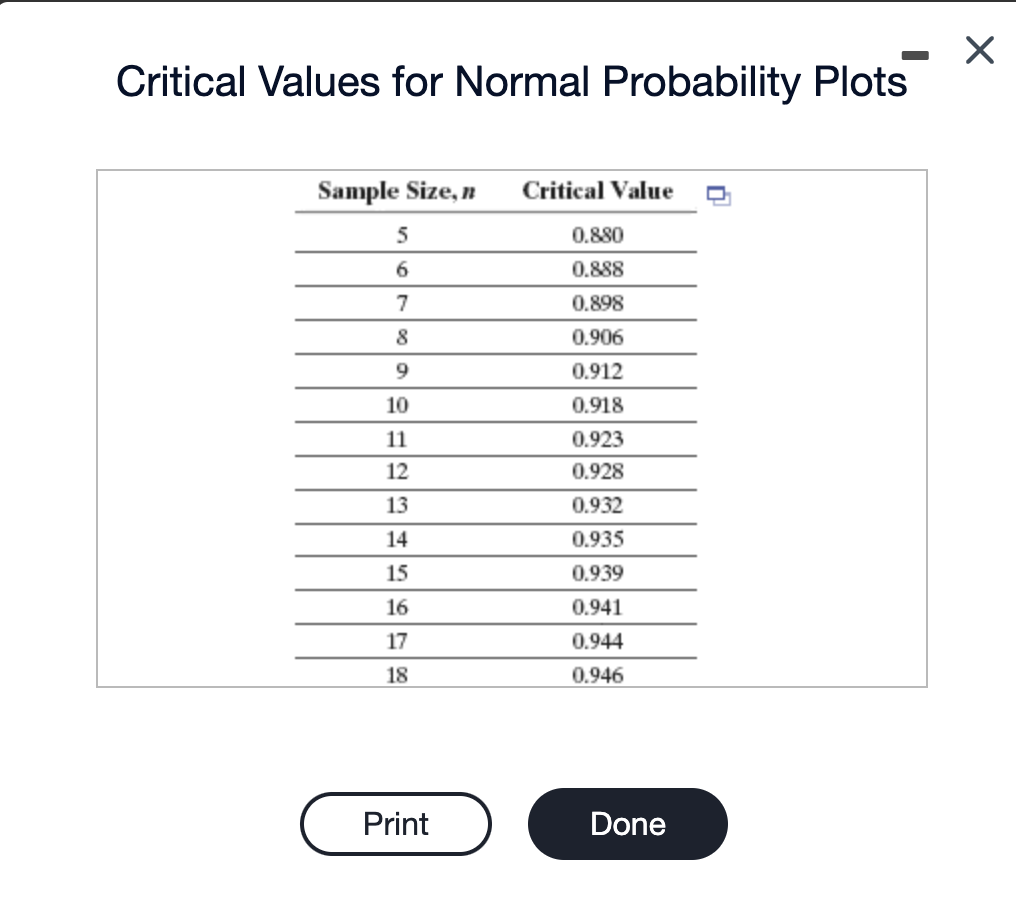
Critical Values for Normal Probability Plots
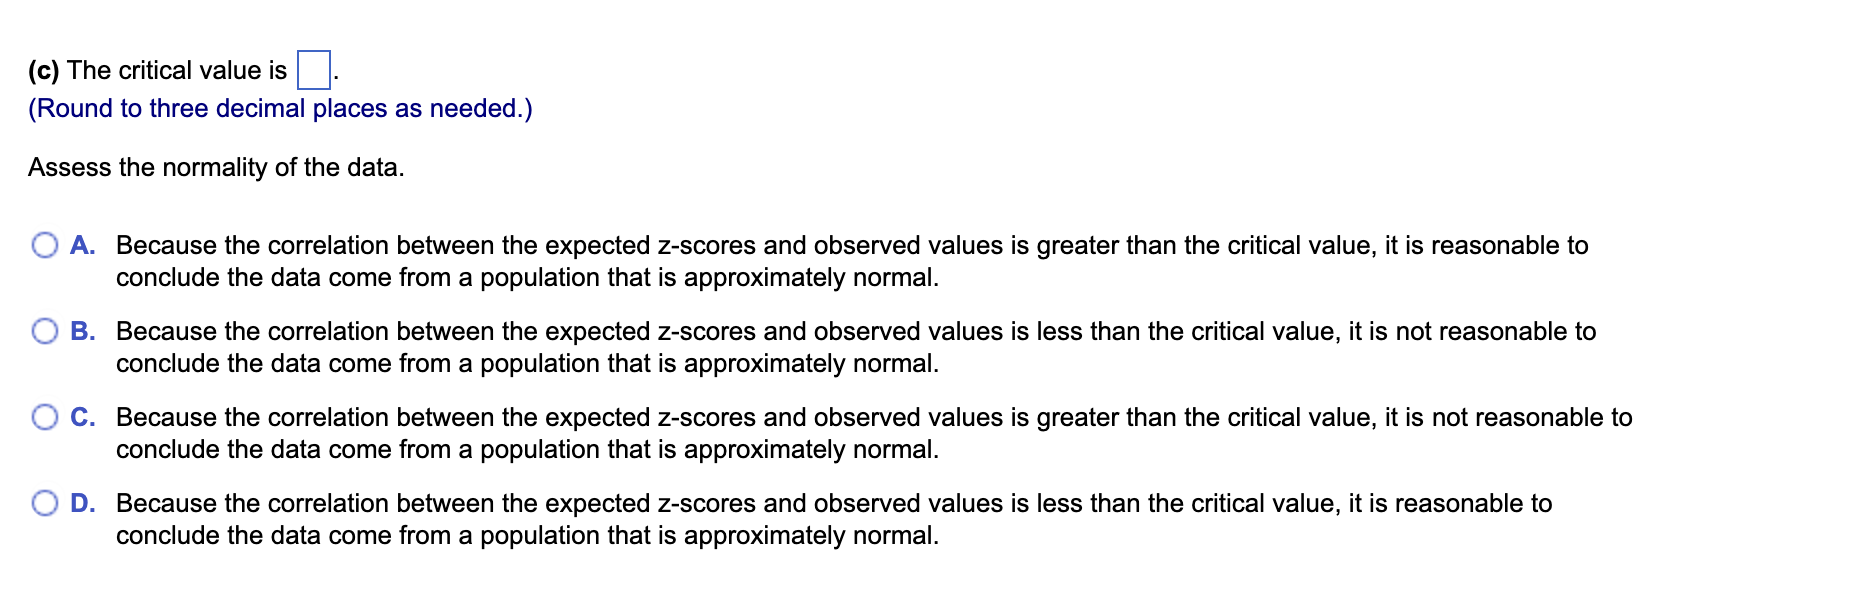
(c) The critical value is (Round to three decimal places as needed.) Assess the normality of the data. A. Because the correlation between the expected z-scores and observed values is greater than the critical value, it is reasonable to conclude the data come from a population that is approximately normal. B. Because the correlation between the expected z-scores and observed values is less than the critical value, it is not reasonable to conclude the data come from a population that is approximately normal. C. Because the correlation between the expected z-scores and observed values is greater than the critical value, it is not reasonable to conclude the data come from a population that is approximately normal. D. Because the correlation between the expected z-scores and observed values is less than the critical value, it is reasonable to conclude the data come from a population that is approximately normal.
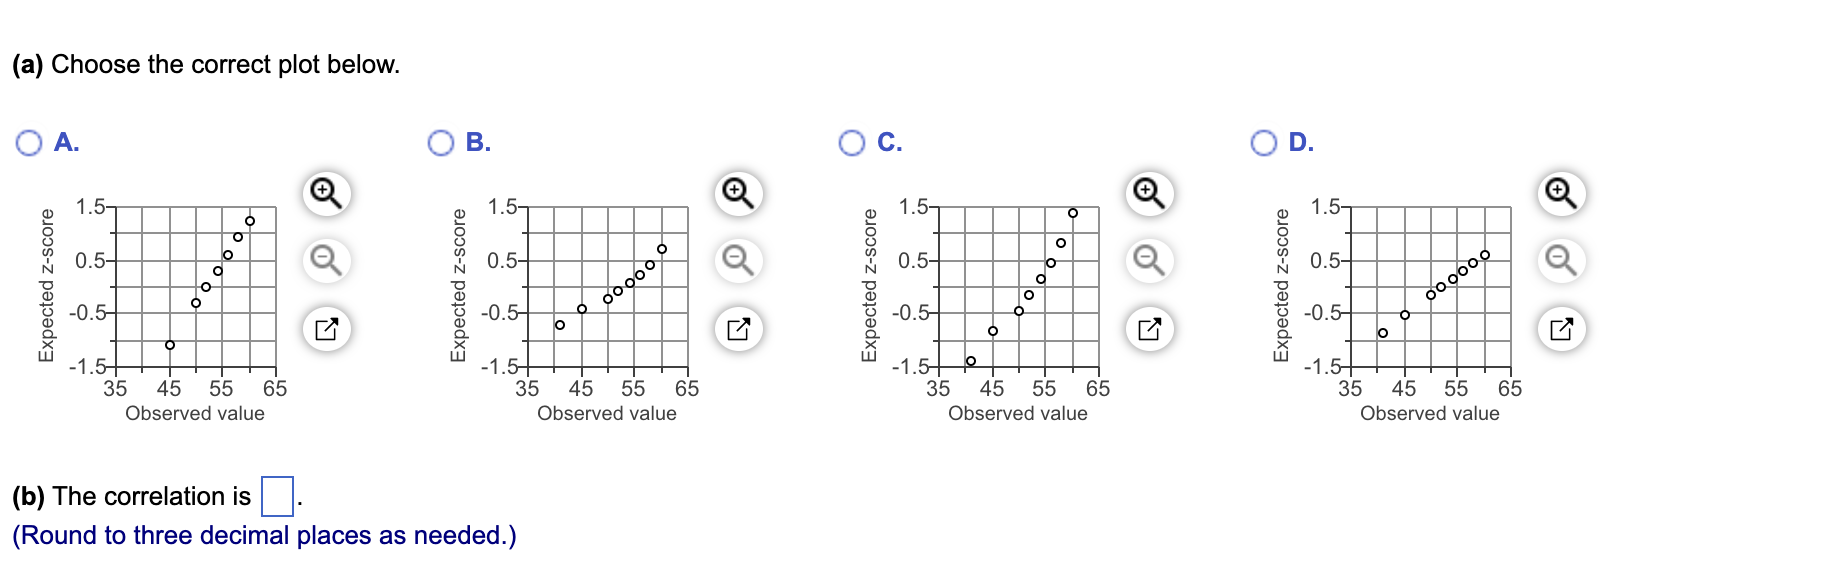
(a) Choose the correct plot below. A. B. C. D. (b) The correlation is (Round to three decimal places as needed.)