Home /
Expert Answers /
Statistics and Probability /
data-on-fith-grade-test-scores-reading-and-mathemaics-for-417-school-dstricts-in-calfoenia-yield-pa389
(Solved): Data on fith-grade test scores (reading and mathemaics) for 417 school dstricts in Calfoenia yield ...
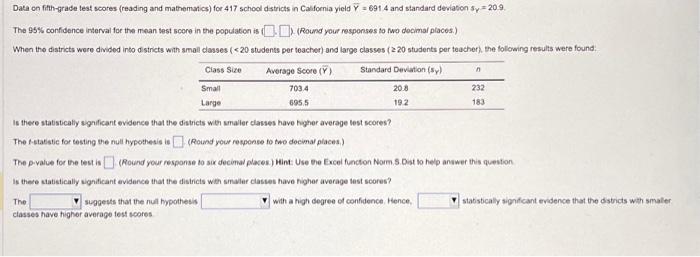
Data on fith-grade test scores (reading and mathemaics) for 417 school dstricts in Calfoenia yield and standard deviaton . The confidence interval for the mean test score in the population is: i (Round you responses to mo docimal places.) When the districts wore divided into districts with small classes ( students per teacher) and large classes ( 220 students per teacher), the folowing results were found: Is there statistically sogificant evidence that the districts wer smaller classes have higher average lest scores? The t-stabstic for testing the null hypothesis is (Round your response to two decinal places.) The pivalue for the test is (Round your response to six decimal places) Wint: Use ge Excel functon Nom, s. Ost to help anawer this question Is there statistically vignificant evidence that the districts with smaler clastes have higher average lest scores? The suggeuts that the nual hypothesis with a high degree of confidence. Hence, stabisticaly signicicant evidence that the dstricts wht smaler classes have highor average test noores.