Home /
Expert Answers /
Statistics and Probability /
data-on-fifth-grade-test-scores-reading-and-mathematics-for-420-school-districts-in-california-y-pa298
(Solved): Data on fifth-grade test scores (reading and mathematics) for 420 school districts in California y ...
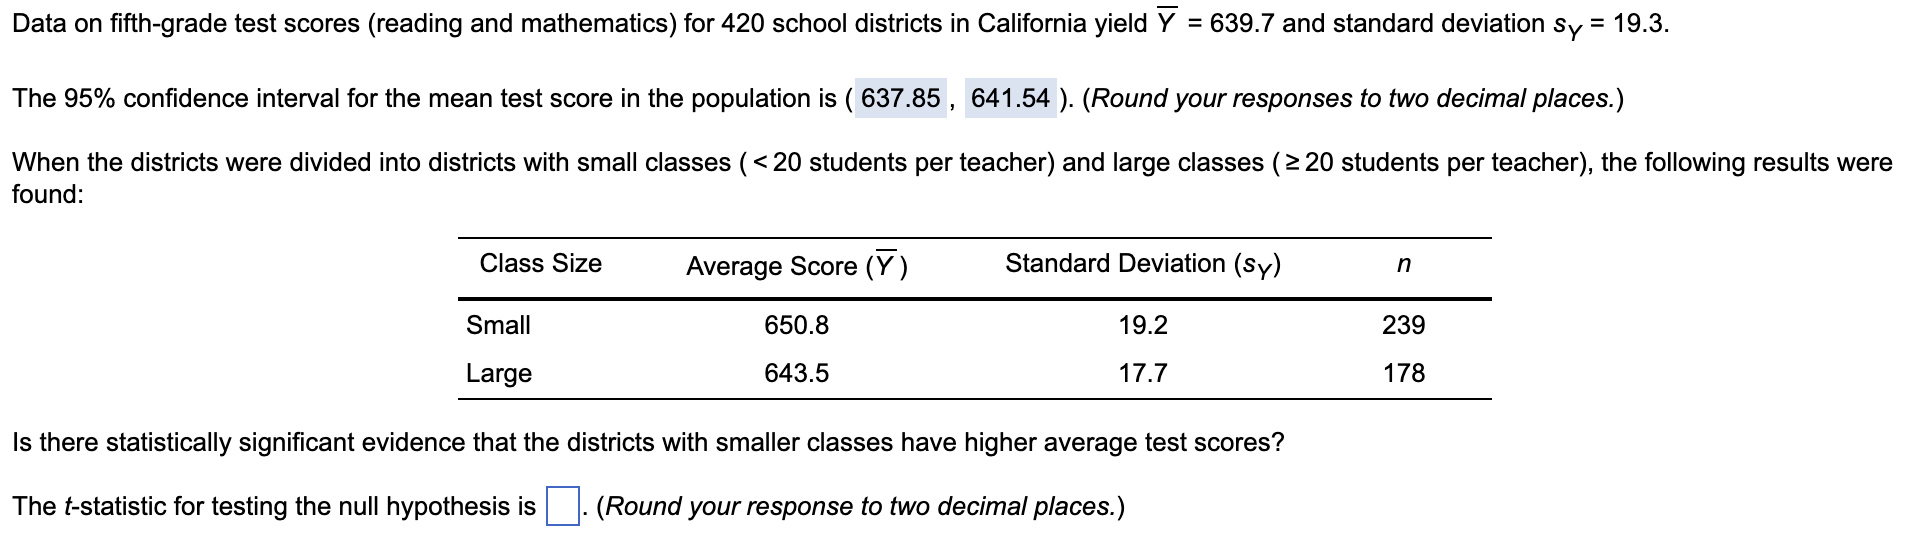
Data on fifth-grade test scores (reading and mathematics) for 420 school districts in California yield Y = 639.7 and standard deviation sy = 19.3. The 95% confidence interval for the mean test score in the population is (637.85, 641.54 ). (Round your responses to two decimal places.) When the districts were divided into districts with small classes (<20 students per teacher) and large classes (?20 students per teacher), the following results were found: Class Size Small Large Average Score (Y) 650.8 643.5 Standard Deviation (sy) 19.2 17.7 Is there statistically significant evidence that the districts with smaller classes have higher average test scores? The t-statistic for testing the null hypothesis is (Round your response to two decimal places.) n 239 178