Home /
Expert Answers /
Advanced Physics /
data-analysis-you-studied-resistivity-of-brass-in-this-experiment-the-same-experiment-was-condu-pa902
(Solved): Data Analysis You studied resistivity of brass in this experiment. The same experiment was condu ...
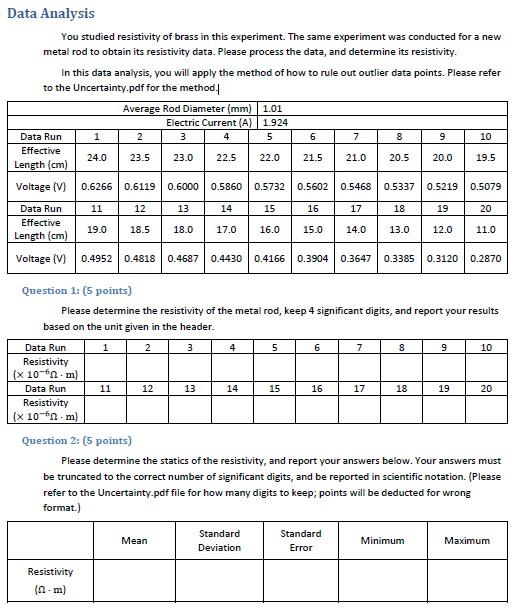
Data Analysis You studied resistivity of brass in this experiment. The same experiment was conducted for a new metal rod to obtain its resistivity data. Please process the data, and determine its resistivity. In this data analysis, you will apply the method of how to rule out outlier data points. Please refer to the Uncertainty.pdf for the method. Question 1: (5 points) Please determine the resistivity of the metal rod, keep 4 significant digits, and report your results based on the unit given in the header. Question 2: (5 points) Please determine the statics of the resistivity, and report your answers below. Your answers must be truncated to the correct number of significant digits, and be reported in scientific notation. (Please refer to the Uncertainty.pdf file for how many digits to keep; points will be deducted for wrong format.)
How many times does the minimum resistivity value occur in the data set? Is the minimum resistivity value an outlier? Please refer to the Chauvenet's Criterion in the Uncertainty.pdf. uestion 4: (5 points) How many times does the maximum resistivity value occur in the data set? Is the maximum resistivity value an outlier? Please refer to the Chauvenet's Criterion in the Uncertainty.pdf.
Expert Answer
Explanation:Average diameter of rod1 is=1.0106mm =1.0106x10⁻³mAverage diameter of rod2=0.8162mm