Home /
Expert Answers /
Economics /
costs-un-the-short-run-versus-in-the-long-run-5-costs-in-the-short-run-versus-in-the-long-run-scoot-pa296
(Solved): costs un the short run versus in the long run 5. Costs in the short run versus in the long run Scoot ...
costs un the short run versus in the long run
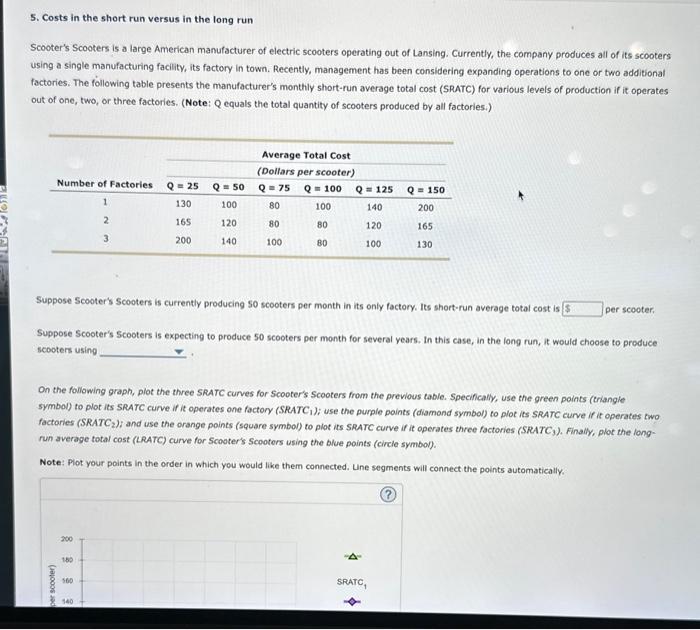
5. Costs in the short run versus in the long run Scooter's Scooters is a large American manufacturer of electric scooters operating out of Lansing. Currently, the company produces all of its scooters using a single manufacturing facility, its factory in town. Recently, management has been considering expanding operations to one or two additional factories. The following table presents the manufacturer's monthly short-run average total cost (SRATC) for various levels of production if it operates out of one, two, or three factories. (Note: Q equals the total quantity of scooters produced by all factories.) Suppose Scooter's Scooters is currently producing 50 scooters per month in its only factory. Its short-run average total cost is per scooter. Suppose Scooter's Scooters is expecting to produce 50 scooters per month for several years. In this case, in the long run, it would choose to produce scooters using On the following graph, plot the three SRATC curves for Scooter's Scooters from the previous table. Specifically, use the green points (triangle symbol) to plot its SRATC curve if it operates one factory (SRATC 1 ); use the purple points (diamond symbol) to plot its SRATC curve if it operates two factories (SRATC 2 ); and use the orange points (square symbol) to plot its SRATC curve if it operates three factories (SRATC 3 ). Finally, plot the longrun average total cost (LRATC) curve for Scooter's Scooters using the blue points (circle symbol). Note: Plot your points in the order in which you would like them connected. Une segments will connect the points automatically.
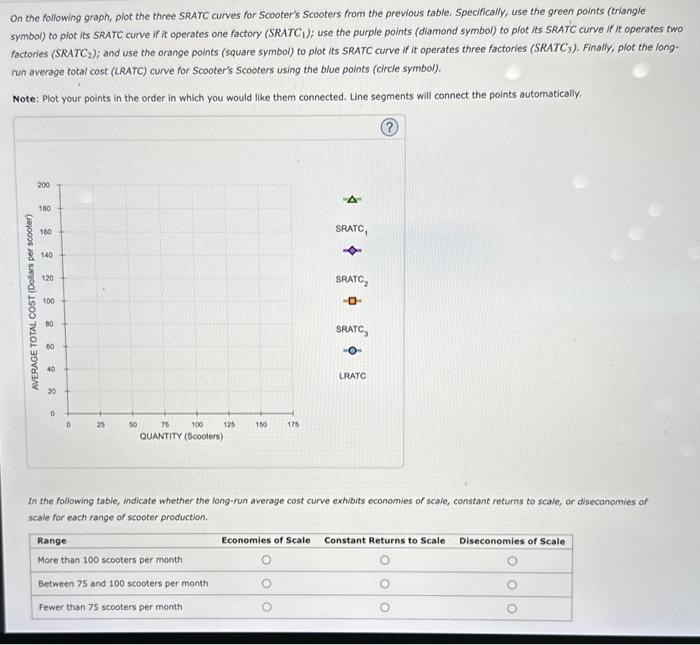
On the following graph, plot the three SRATC curves for Scooter's Scooters from the previous table. Specifically, use the green points (triangle symbol) to plot its SRATC curve if it operates one factory (SRATC1); use the purple points (diamond symbol) to plot its SRATC curve if it operates two factories (SRATC 2 ; and use the orange points (square symbol) to plot its SRATC curve if it operates three factories (SRATC 3 ). Finally, plot the long. run average total cost (LRATC) curve for Scooter's Scooters using the bive points (dirle symbol). Note: Plot your points in the order in which you would like them connected. Line segments will connect the points automatically. In the following table, indicate whether the long-run average cost curve extibits economies of scale, constant returns to scale, or diseconomies of scale for each range of scooter production.
Expert Answer
Currently, the firm is operating in only one factory producing 50 scooters. We can see that in the t...