Home /
Expert Answers /
Biology /
cory-generated-a-bsa-protein-standard-curve-figure-2-use-the-equation-of-the-line-in-figure-2-to-pa475
(Solved): Cory generated a BSA protein standard curve (figure 2). Use the equation of the line in figure 2 to ...
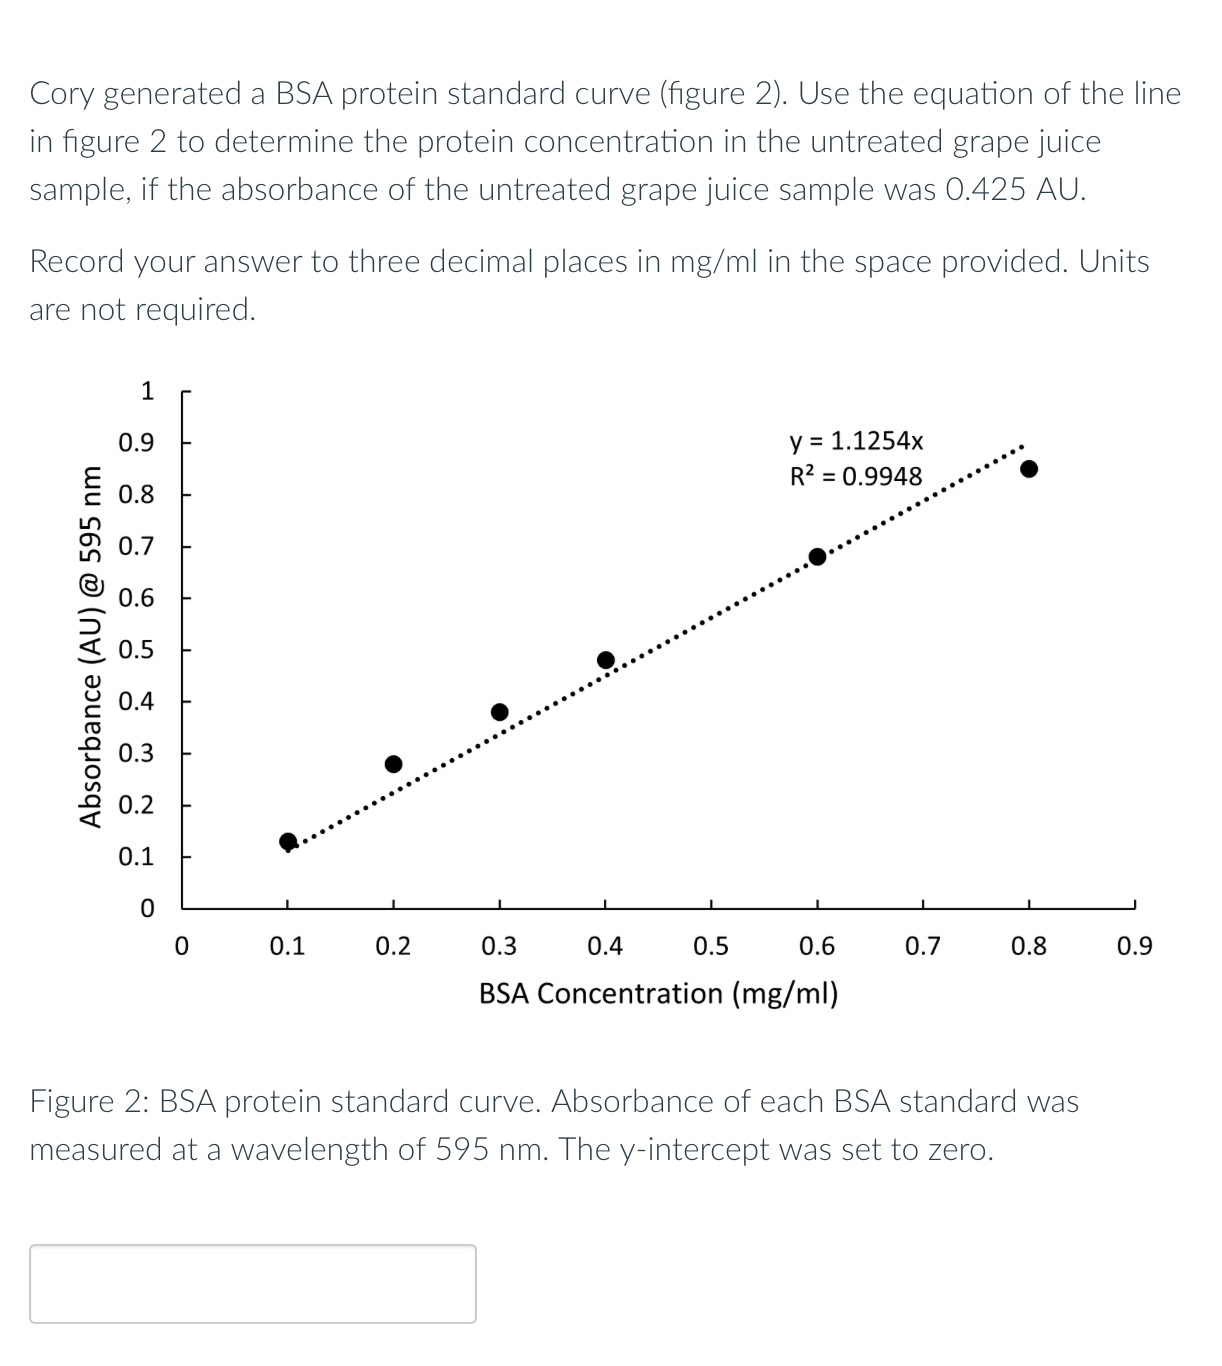
Cory generated a BSA protein standard curve (figure 2). Use the equation of the line in figure 2 to determine the protein concentration in the untreated grape juice sample, if the absorbance of the untreated grape juice sample was 0.425 AU. Record your answer to three decimal places in
m(g)/(m)lin the space provided. Units are not required. Figure 2: BSA protein standard curve. Absorbance of each BSA standard was measured at a wavelength of
595nm. The
y-intercept was set to zero.