Home /
Expert Answers /
Statistics and Probability /
construct-a-normal-probability-plot-for-the-following-sample-of-observations-on-coating-thickness-pa978
(Solved): Construct a normal probability plot for the following sample of observations on coating thickness ...
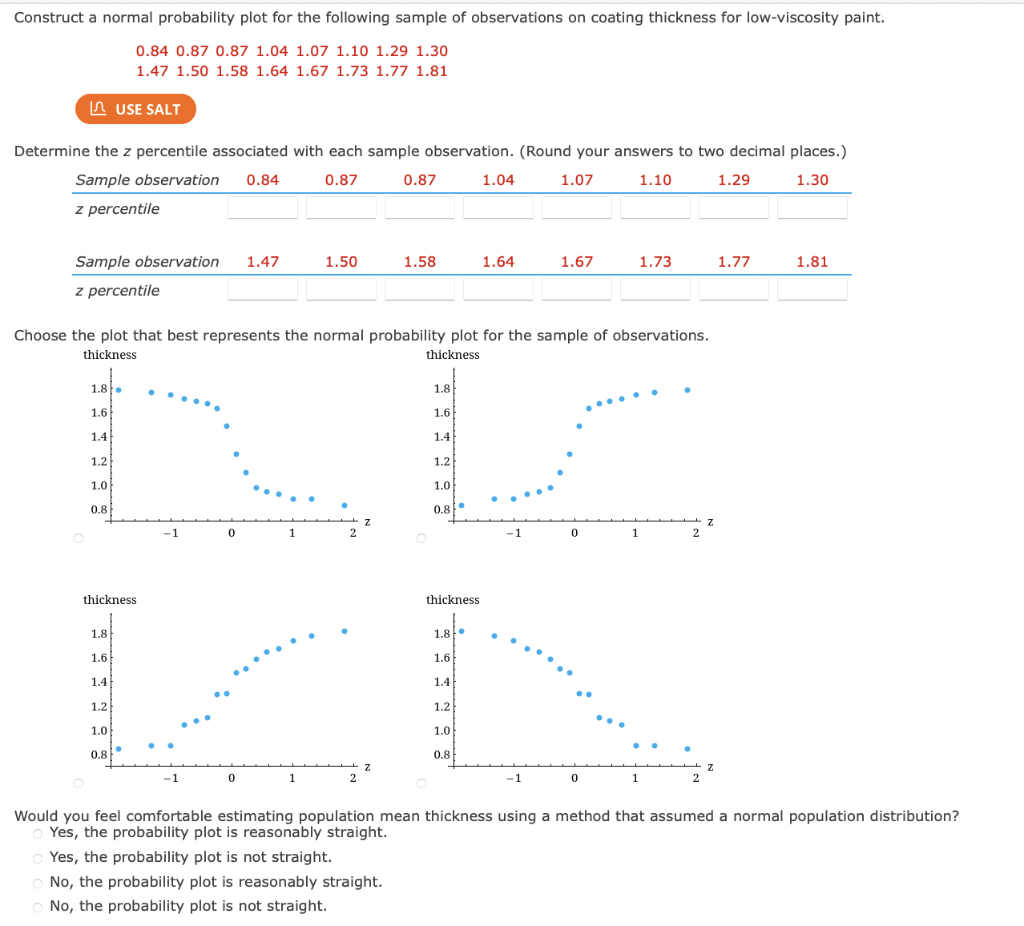
Construct a normal probability plot for the following sample of observations on coating thickness for low-viscosity paint. 0.84 0.87 0.87 1.04 1.07 1.10 1.29 1.30 1.47 1.50 1.58 1.64 1.67 1.73 1.77 1.81 Determine the z percentile associated with each sample observation. (Round your answers to two decimal places.) Sample observation 0.84 0.87 1.07 1.10 1.30 z percentile Sample observation 1.47 z percentile O USE SALT 1.8. 1.6 1.4 1.2 1.0 0.8 thickness 1.8 1.6 1.4 1.2 1.0 0.8 Choose the plot that best represents the normal probability plot for the sample of observations. thickness thickness -1 0 0 1 1.50 1 2 2 Z 0.87 Z 1.58 O 1.8 1.6 1.4 1.2 1.0 0.8 thickness 1.8 1.6 1.4 1.04 1.2 1.0 0.8 1.64 -1 1.67 -1 0 1.73 0 1 1 2 2 Z Z 1.29 1.77 1.81 Would you feel comfortable estimating population mean thickness using a method that assumed a normal population distribution? Yes, the probability plot is reasonably straight. Yes, the probability plot is not straight. No, the probability plot is reasonably straight. No, the probability plot is not straight.
