Home /
Expert Answers /
Economics /
consider-the-weekly-market-for-gyros-in-a-popular-neighborhood-close-to-campus-suppose-this-market-pa795
(Solved): Consider the weekly market for gyros in a popular neighborhood close to campus, Suppose this market ...
Consider the weekly market for gyros in a popular neighborhood close to campus, Suppose this market is operating in long-run competitme equilibrium with many gyro vendors in the neighborhood, each offering basically the same gyros. Due to the structure of the market, the vendors act as price takers and each individual vendor has no market power. The following graph disptays the supply \( (S=M C) \) and demand (D) curves in the weekly market for gyros. Place the black point (plus symbol) on the graph to indicate the market price and quantify that will result from competibon.
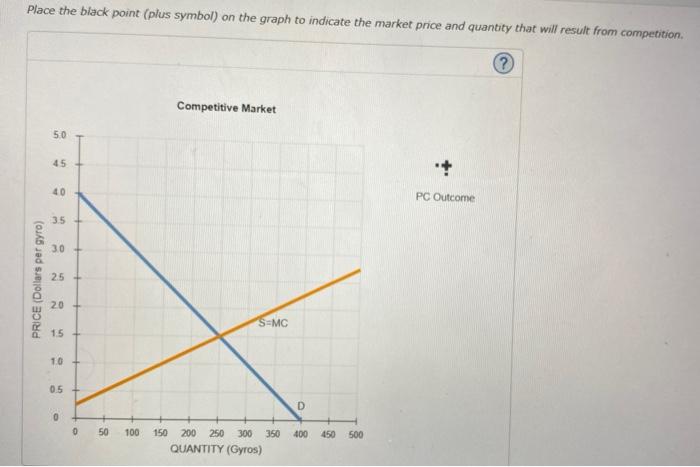
Place the black point (plus symbol) on the graph to indicate the market price and quantity that will result from competition.
Now assume that one of the gyro vendors successfully petitions the neighborhood development board to obtain exclusive rights to sell gyros in the neighborhood. This furm buys up all the rest of the gyro food trucks in the area and begins to operate as a monopoly. Assurne that this change does not affect demand and that the marginal cost curve of the new monopoly corresponds exactly to the supply curve from the previous graph. The following graph reflects this new set of assumptions, and shows the demand (D), marginal revenue (MR), and marginal cost (MC) curves for the monopoly vendor, Place the black point (plus symbol) an the following graph to indicate the profit-maximizing price and quantity of a monopolist.
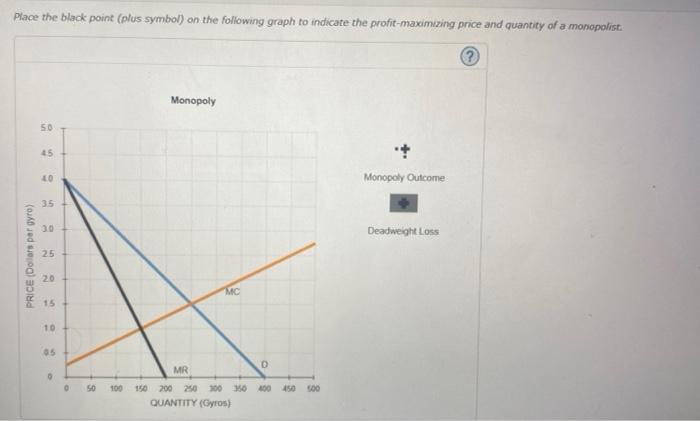
Place the black point (plus symbol) on the following graph to indicate the profit-maxamuing price and quantity of a monopolist:
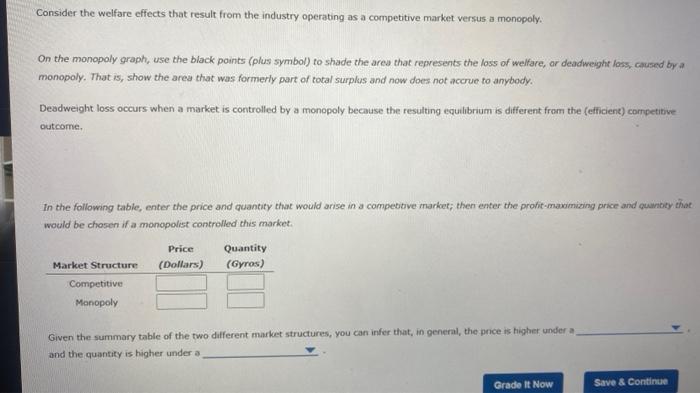
Consider the welfare effects that result from the industry operating as a competitive market versus a monopoly. On the monopoly graph, use the black points (plus symbol) to shade the area that represents the loss of welfare, or deadweight loss, carised by a monopoly. That is, show the area that was formerly part of total surplus and now does not accue to anybody. Deadweight loss occurs when a market is controlled by a monopoly because the resulting equtibrium is different from the (efficient) competibve cutcome. In the following table, enter the price and quantity that would arise in a competive market; then enter the profit-mavimizing price and quantity that, would be chosen if a monopolist controlled this market. Given the summary table of the two different market structures, you can infer that, in general, the price is higher under a and the quantity is higher under a
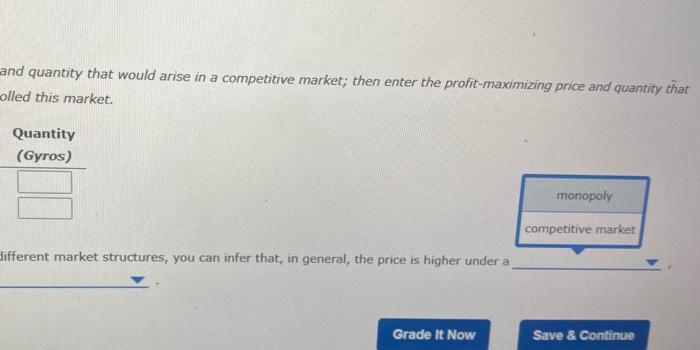
and quantity that would arise in a competitive market; then enter the profit-maximizing price and quantity that olled this market. ifferent market structures, you can infer that, in general, the price is higher under a
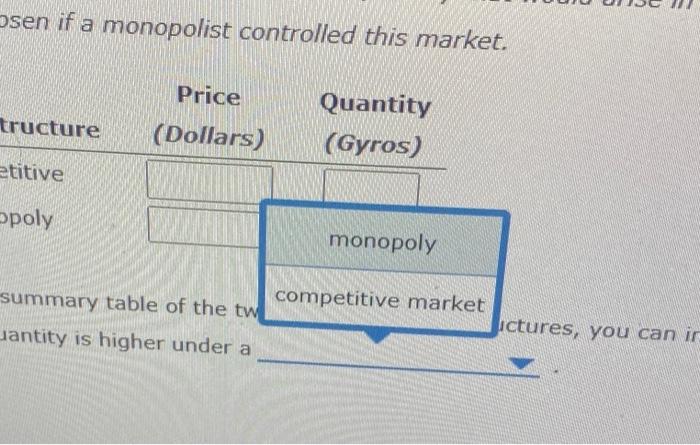
Sen if a monopolist controlled this market. tures, you can in