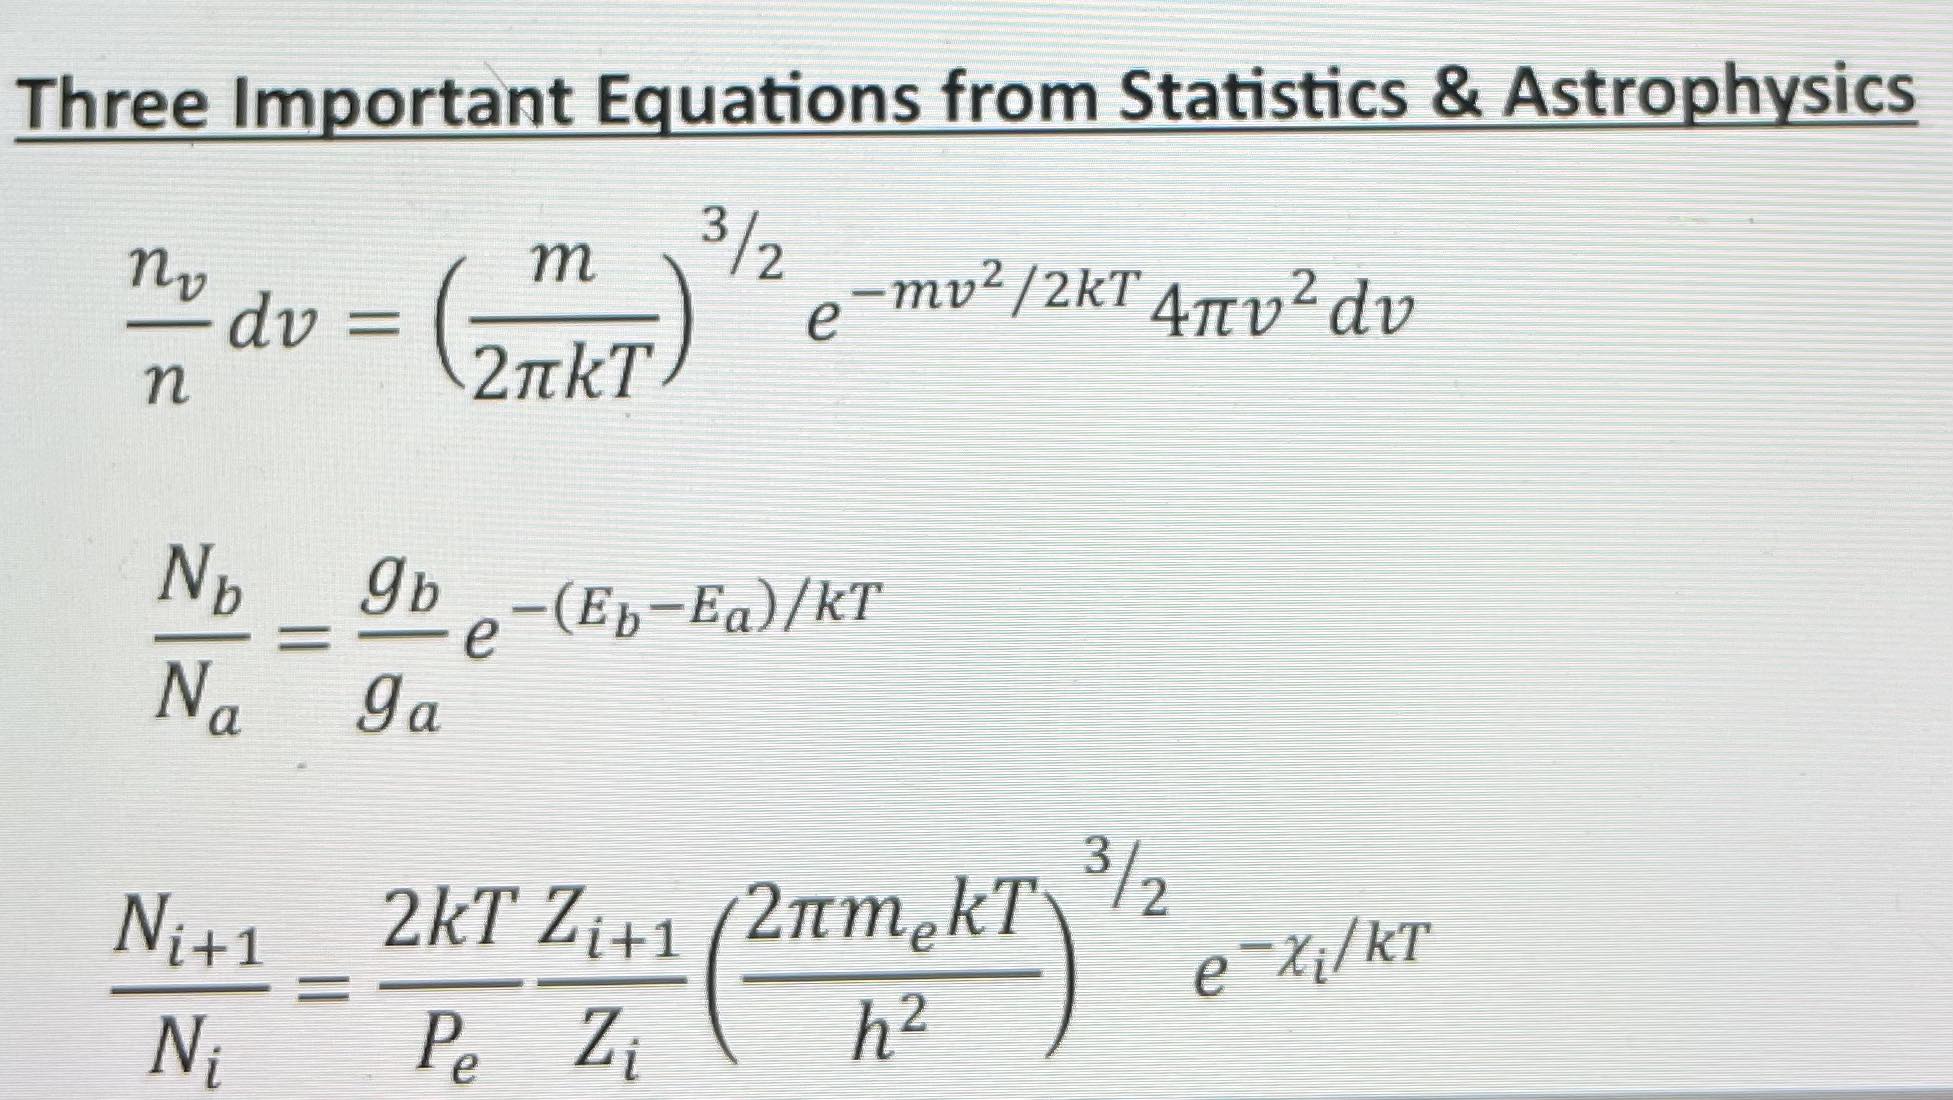
(Solved): Consider a stellar atmosphere of temperature 30,000K.a) Use Excel to plot hydrogen atoms speed di ...
Consider a stellar atmosphere of temperature 30,000K.
a) Use Excel to plot hydrogen atoms’ speed distribution in this atmosphere. That is, plot ????????/???? as a function of ????. Let ???? run from 0 m/s to 100,000 m/s in intervals of 10 m/s. (Excel can easily handle 10,000 rows). The mass of hydrogen is 1.661 × 10?27 ????g and ???? = 1.381 × 10?23 ????/????.
I usually plot a smoothed curve rather than the data points. You can do this by double-clicking on the data points. Make a print-out of this graph.
b) Find the total area under the curve by summing the areas of each of the 10,000 rectangles.
This should be 1. (Remember that each of the skinny rectangles has width 10 m/s)
c) Read off the most probable speed from your table and compare this to the expected value.
d) Use your table to compute the fraction of hydrogen atoms having speeds between 10,000 and 20,000 ????/???? in this atmosphere. To do this you will add together the areas of the rectangles between ???? = 10,000 and ???? = 20,000 ????/????. This should be nearly 0.3 or 30%.
