Home /
Expert Answers /
Physics /
consider-a-pressure-versus-volume-graph-where-the-different-curves-represent-different-processes-pa653
(Solved): Consider a pressure versus volume graph, where the different curves represent different processes ...
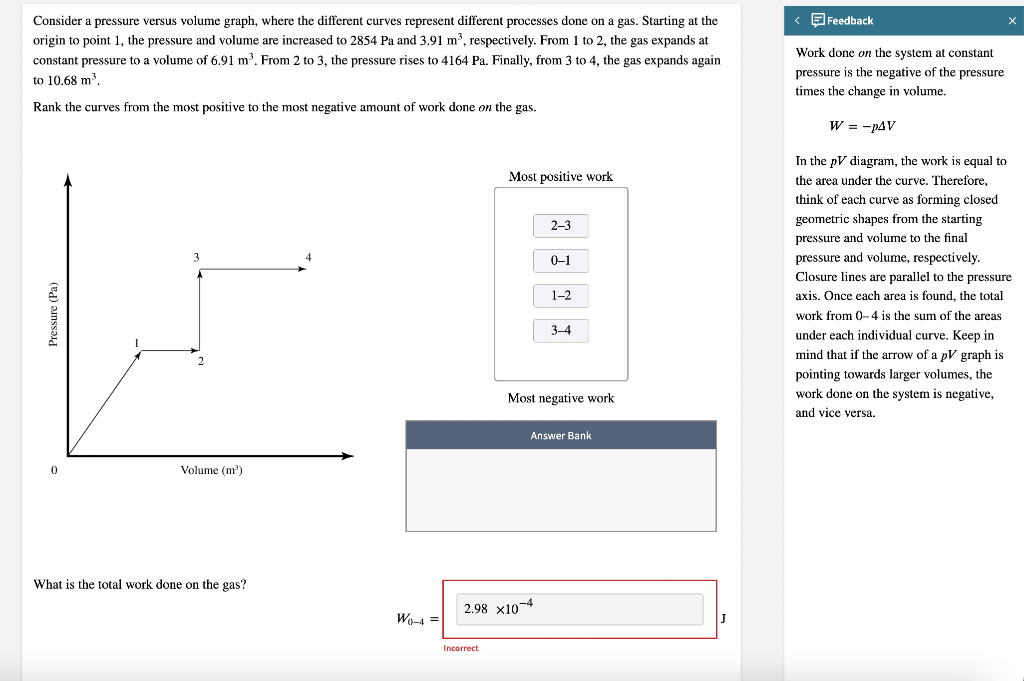
Consider a pressure versus volume graph, where the different curves represent different processes done on a gas. Starting at the origin to point 1, the pressure and volume are increased to \( 2854 \mathrm{~Pa} \) and \( 3.91 \mathrm{~m}^{3} \), respectively. From 1 to 2 , the gas expands at \( < \) Feedback Work done on the system at constant pressure is the negative of the pressure times the change in volume. \[ W=-p \Delta V \] In the \( p V \) diagram, the work is equal to the area under the curve. Therefore, think of each curve as forming closed geometric shapes from the starting pressure and volume to the final pressure and volume, respectively. Closure lines are parallel to the pressure axis. Once each area is found, the total work from \( 0-4 \) is the sum of the areas under each individual curve. Keep in mind that if the arrow of a \( p V \) graph is mind that if the arrow of a \( p V \) graph is pointing towards larger volumes, the work done on the system is negative, and vice versa. What is the total work done on the gas?