Home /
Expert Answers /
Statistics and Probability /
consider-a-binary-response-variable-y-and-a-predictor-variable-x-the-following-table-pa345
(Solved): Consider a binary response variable \( y \) and a predictor variable \( x \). The following table ...
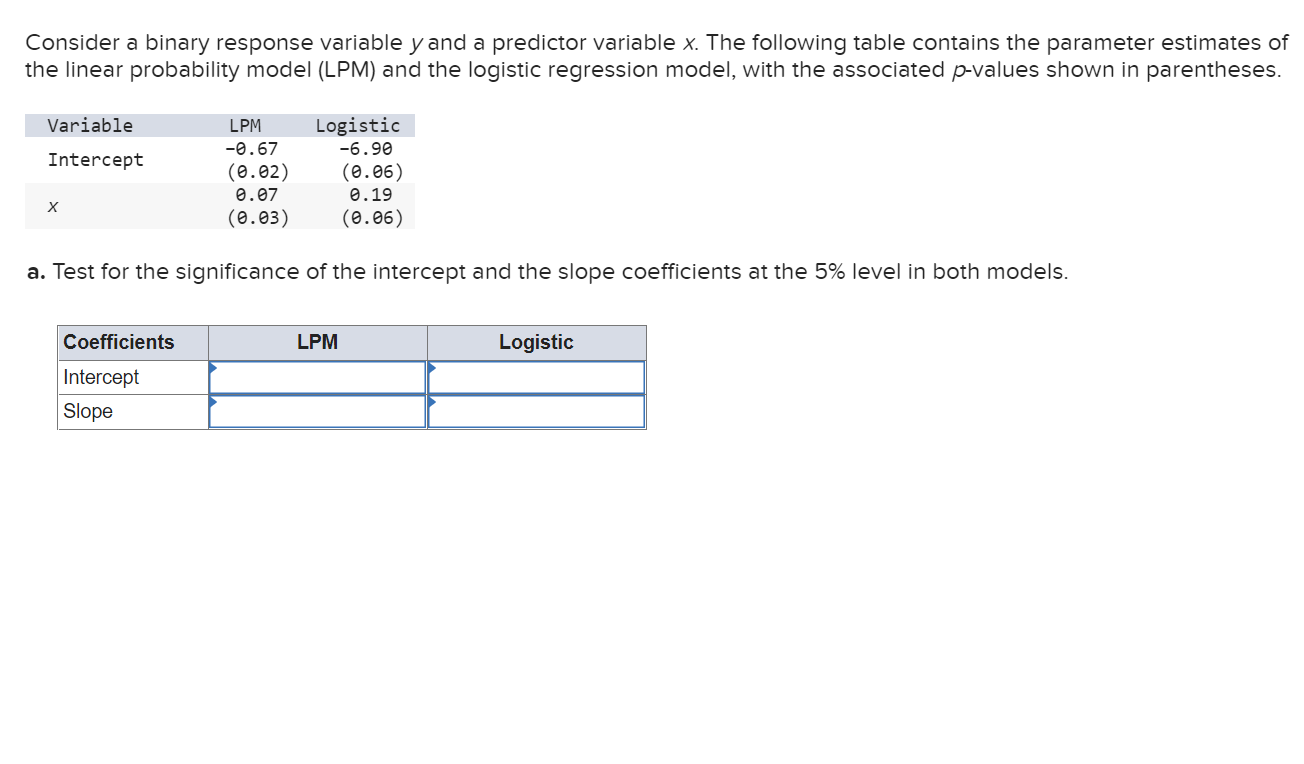
Consider a binary response variable \( y \) and a predictor variable \( x \). The following table contains the parameter estimates of the linear probability model (LPM) and the logistic regression model, with the associated \( p \)-values shown in parentheses. a. Test for the significance of the intercept and the slope coefficients at the \( 5 \% \) level in both models.
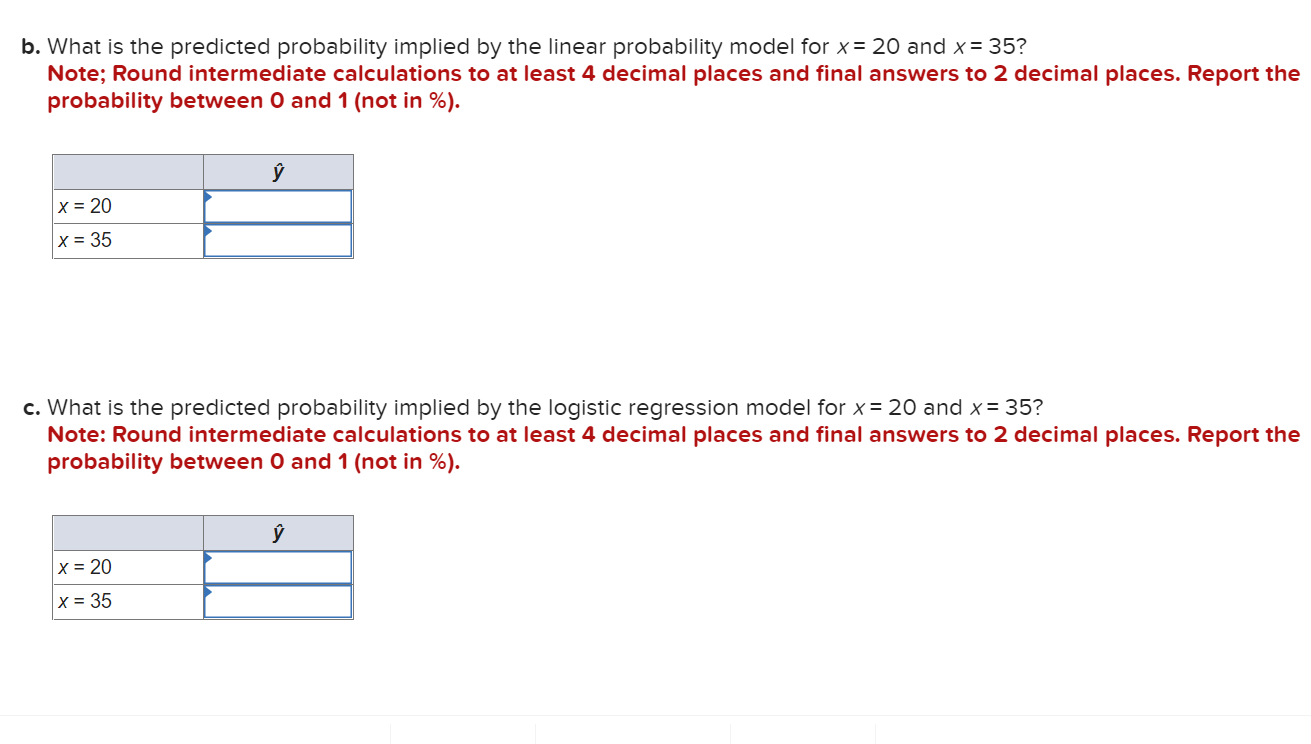
b. What is the predicted probability implied by the linear probability model for \( x=20 \) and \( x=35 \) ? Note; Round intermediate calculations to at least 4 decimal places and final answers to 2 decimal places. Report the probability between 0 and 1 (not in \%). c. What is the predicted probability implied by the logistic regression model for \( x=20 \) and \( x=35 \) ? Note: Round intermediate calculations to at least 4 decimal places and final answers to 2 decimal places. Report the probability between 0 and 1 (not in \%).
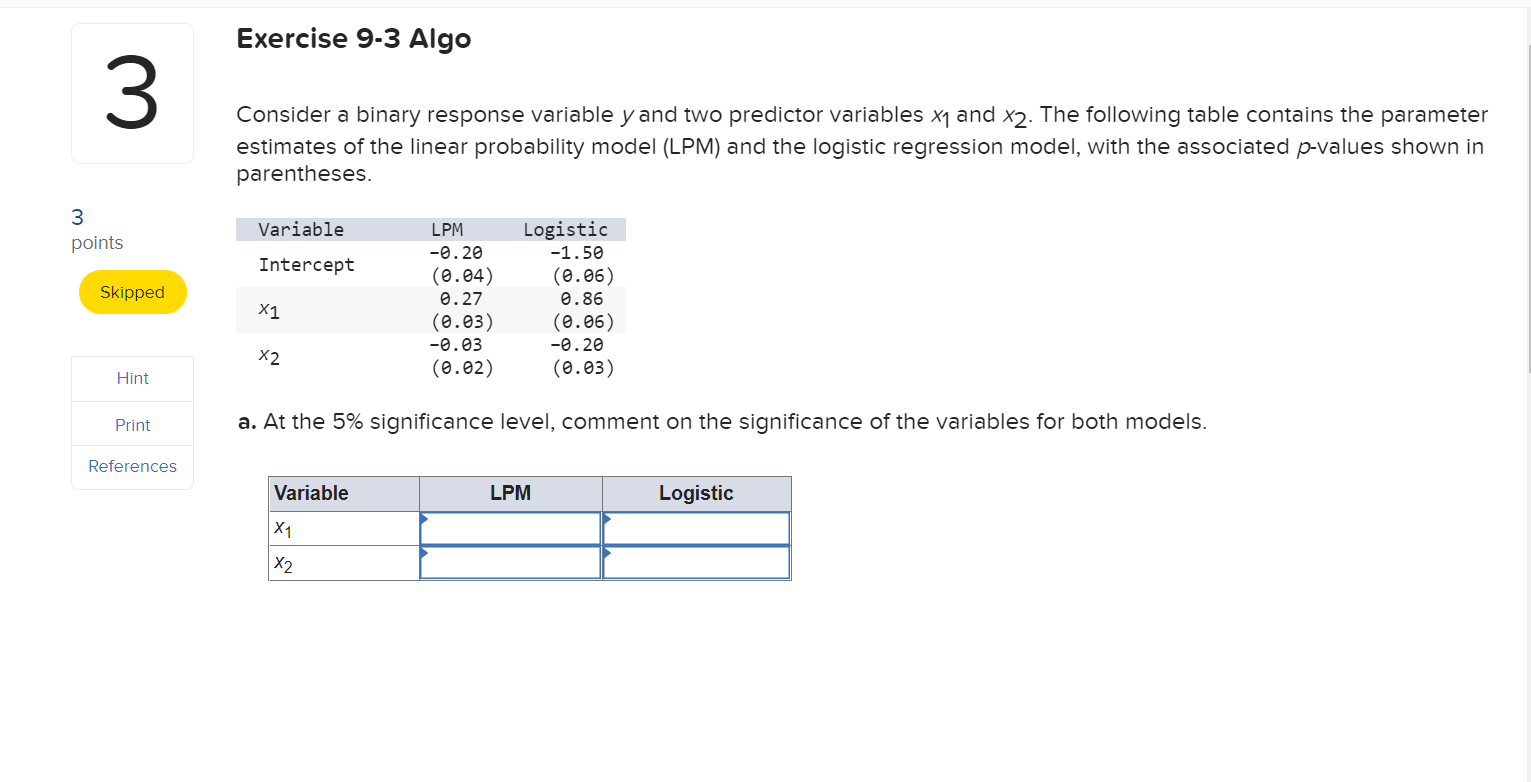
Consider a binary response variable \( y \) and two predictor variables \( x_{1} \) and \( x_{2} \). The following table contains the parameter estimates of the linear probability model (LPM) and the logistic regression model, with the associated \( p \)-values shown in parentheses. a. At the \( 5 \% \) significance level, comment on the significance of the variables for both models.
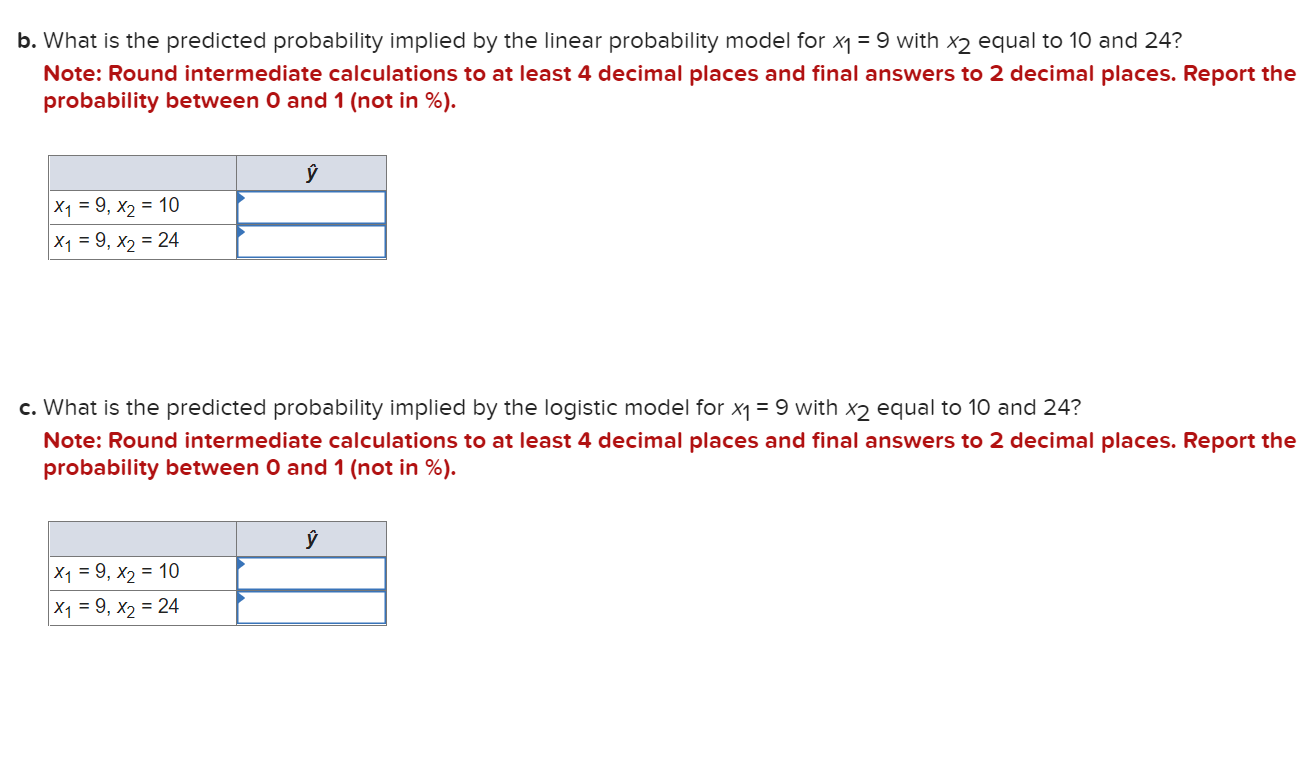
b. What is the predicted probability implied by the linear probability model for \( x_{1}=9 \) with \( x_{2} \) equal to 10 and \( 24 ? \) Note: Round intermediate calculations to at least 4 decimal places and final answers to 2 decimal places. Report the probability between 0 and 1 (not in \%). c. What is the predicted probability implied by the logistic model for \( x_{1}=9 \) with \( x_{2} \) equal to 10 and 24 ? Note: Round intermediate calculations to at least 4 decimal places and final answers to 2 decimal places. Report the probability between 0 and 1 (not in \%).
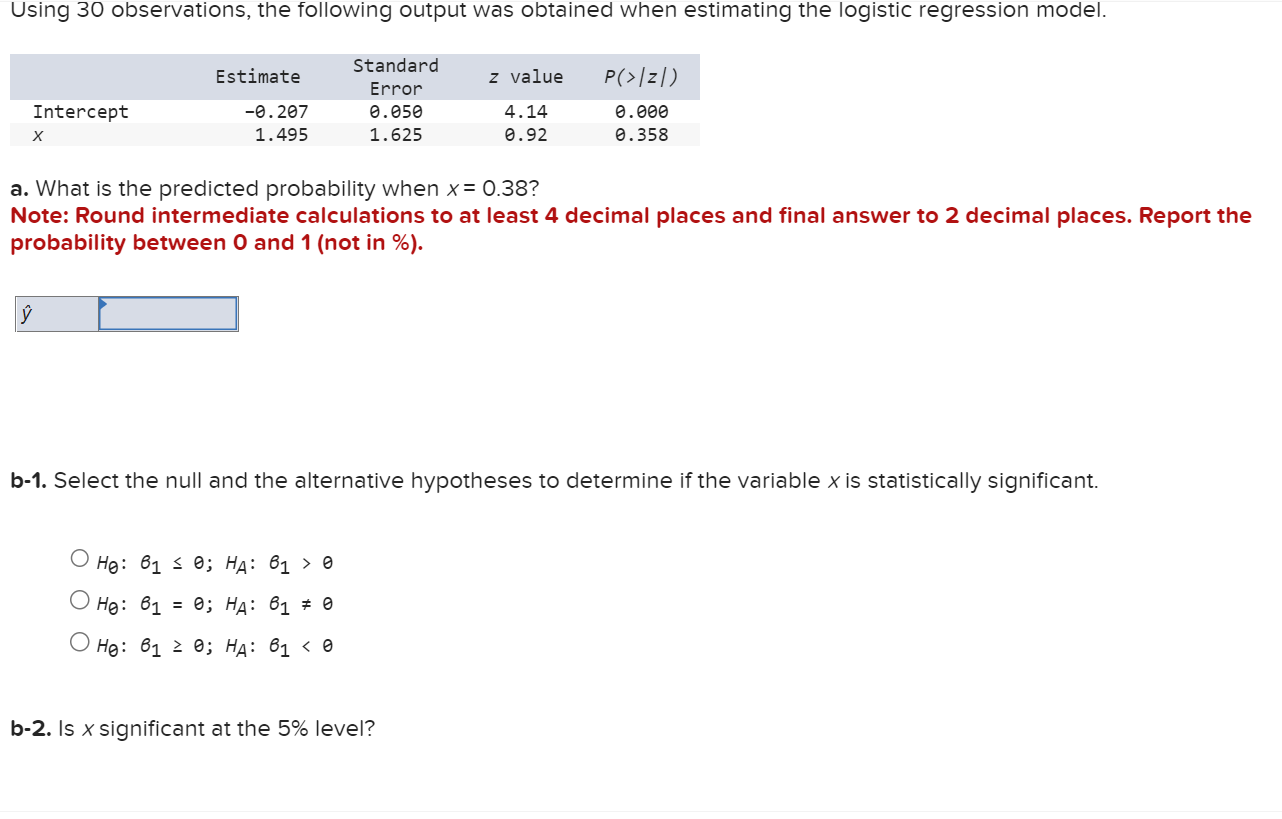
a. What is the predicted probability when \( x=0.38 ? \) Note: Round intermediate calculations to at least 4 decimal places and final answer to 2 decimal places. Report the probability between 0 and 1 (not in \%). b-1. Select the null and the alternative hypotheses to determine if the variable \( x \) is statistically significant. \( H_{0}: B_{1} \leq 0 ; H_{A}: B_{1}>0 \) \( H_{0}: b_{1}=0 ; H_{A}: \theta_{1} \neq 0 \) \( H_{\theta}: B_{1} \geq 0 ; H_{A}: B_{1}<0 \) b-2. Is \( x \) significant at the \( 5 \% \) level?