(Solved): Common Cause Failure Analysis and Cause-Consequence AnalysisThe overall system in the figure below i ...
Common Cause Failure Analysis and Cause-Consequence Analysis
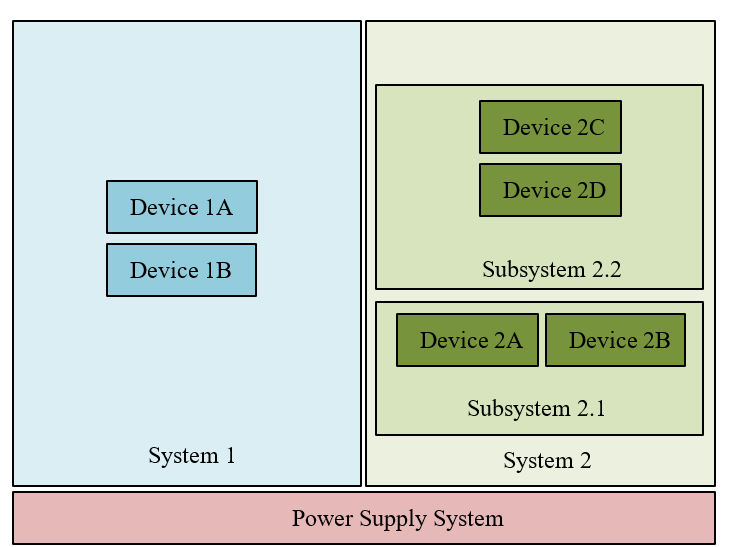
The overall system in the figure below includes three systems: Power Supply System, System 1, and System 2. System 1 and System 2 are arranged in series, and they both need the Power Supply System to operate. The internal devices of System 1 (Device 1A and Device 1B) are arranged in parallel. The internal subsystems of System 2 (Subsystem 2.1 and Subsystem 2.2) are also arranged in parallel. At the device level, Device 2A and Device 2B of Subsystem 2.1 are arranged in series, whereas Device 2C and Device 2D of Subsystem 2.2 are arranged in parallel.
In order to continue operating, the system needs the following conditions to hold:
- The Power Supply is operational, and
- System 1 is operational; System 1 operates if Device 1A or Device 1B, or both, are operational, and
- System 2 is operational; System 2 operates if Subsystem 2.1 or Subsystem 2.2, or both, are operational (i.e., Subsystem 2.1 operates if Device 2A and Device 2B are operational; Subsystem 2.2 operates if Device 2C or Device 2D, or both, are operational).
The time study period is one year, and the individual probabilities of systems/devices being in failed states are as follows:
- Power Supply: 0.005
- Device 1A: 0.025
- Device 1B: 0.025
- Device 2A: 0.001
- Device 2B: 0.001
- Device 2C: 0.025
- Device 2D: 0.025
Answer the following questions:
- Draw the system model (Reliability Block Diagram (RBD) model).
- Conduct Fault Tree Analysis (FTA) of the system by using one of the methodologies presented in the lecture notes. Calculate the resultant probability of failure for the system.
- Add potential common cause/mode failures to the fault tree and draw the resultant tree using the Common Cause Analysis (CCA) methodology. Common causes related to System 1 have a probability of occurrence of 0.001 and common causes related to System 2 have a probability of occurrence of 0.005. Calculate the resultant probability of failure for the system.
- Analyze the system using the Cause-Consequence Analysis methodology. Draw the cause-consequence diagram and the fault trees for the intermediate events. Calculate the resultant probabilities of occurrence of all possible outcomes.
- To improve system safety, an additional identical Device 1C is added to System 1 in parallel with the other two devices 1A and 1B. Answer again to the questions 1) – 4) above and comment on the difference in the results.