Home /
Expert Answers /
Statistics and Probability /
click-here-to-view-a-table-of-critical-values-for-the-correlation-coefficient-construct-a-scatterp-pa937
(Solved): Click here to view a table of critical values for the correlation coefficient. Construct a scatterp ...


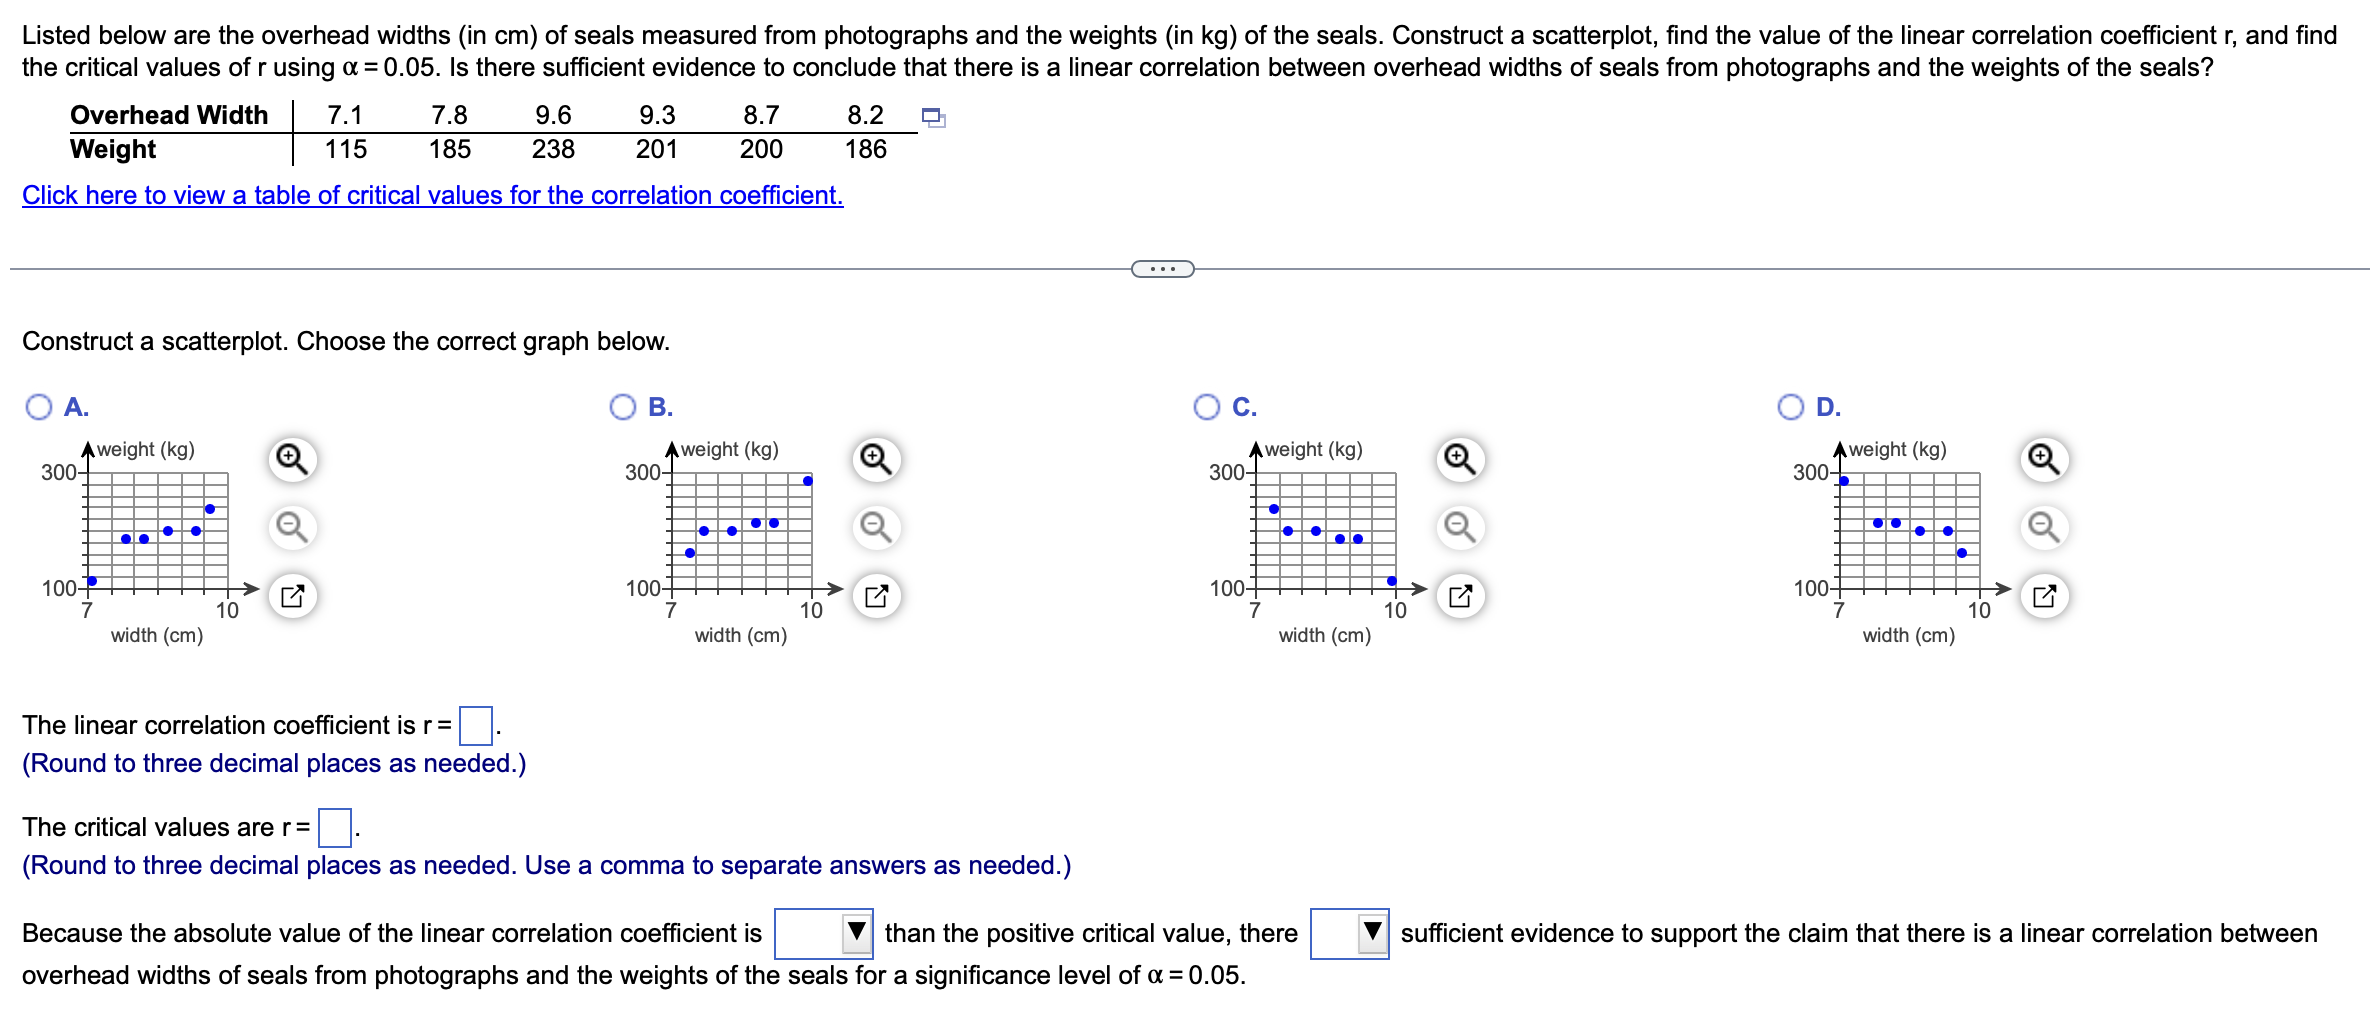
Click here to view a table of critical values for the correlation coefficient. Construct a scatterplot. Choose the correct graph below. A. B. B. c. The linear correlation coefficient is (Round to three decimal places as needed.) The critical values are (Round to three decimal places as needed. Use a comma to separate answers as needed.) Because the absolute value of the linear correlation coefficient is than the positive critical value, there overhead widths of seals from photographs and the weights of the seals for a significance level of . D. sufficient evidence to support the claim that there is a linear correlation between
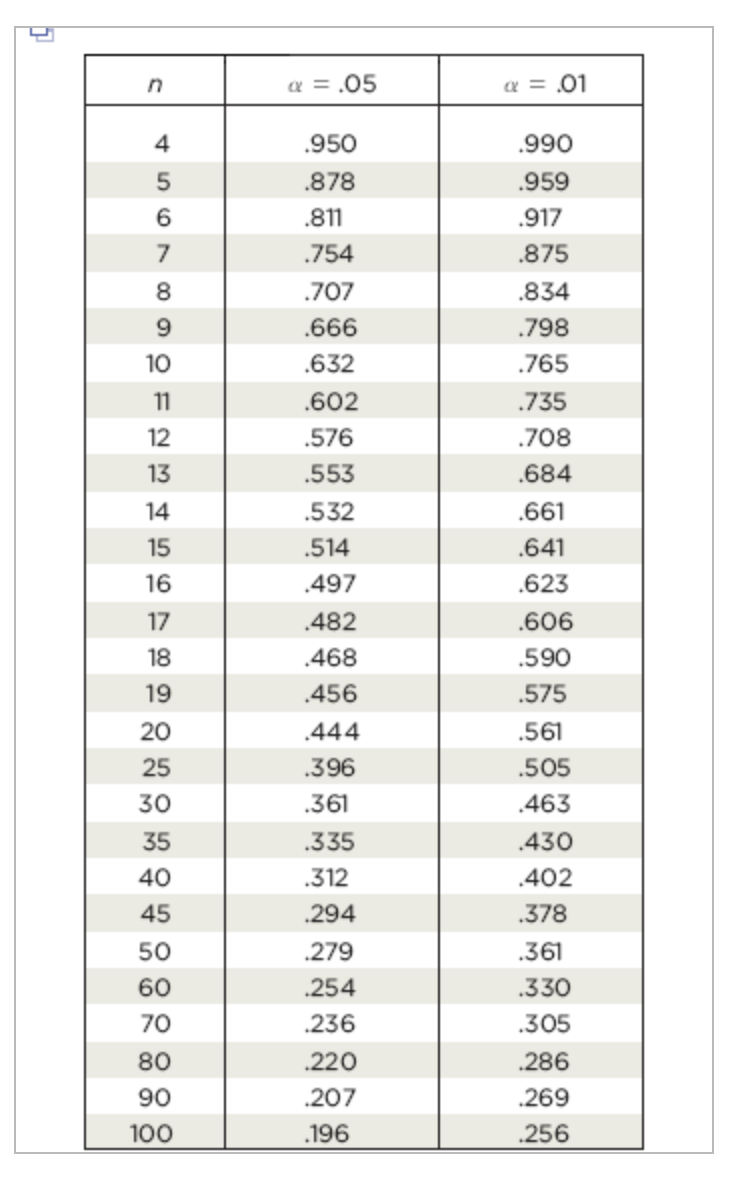
\begin{tabular}{|r|l|l|} \hline \multicolumn{1}{|c|}{} \\ \hline & & \\ \hline 4 & .950 & .990 \\ 5 & .878 & .959 \\ 6 & .811 & .917 \\ 7 & .754 & .875 \\ 8 & .707 & .834 \\ 9 & .666 & .798 \\ 10 & .632 & .765 \\ 11 & .602 & .735 \\ 12 & .576 & .708 \\ 13 & .553 & .684 \\ 14 & .532 & .661 \\ 15 & .514 & .641 \\ 16 & .497 & .623 \\ 17 & .482 & .606 \\ 18 & .468 & .590 \\ 19 & .456 & .575 \\ 20 & .444 & .561 \\ 25 & .396 & .505 \\ 30 & .361 & .463 \\ 35 & .335 & .430 \\ 40 & .312 & .402 \\ 45 & .294 & .378 \\ 50 & .279 & .361 \\ 60 & .254 & .330 \\ 70 & .236 & .305 \\ 80 & .220 & .286 \\ 90 & .207 & .269 \\ 100 & .196 & .256 \\ \hline \end{tabular}