Home /
Expert Answers /
Statistics and Probability /
ch2-q4-consider-the-following-box-plot-part-a-which-quarter-has-the-smallest-spread-of-data-pa404
(Solved): CH2 Q4 Consider the following box plot. Part (a) Which quarter has the smallest spread of data? \ ...
CH2 Q4
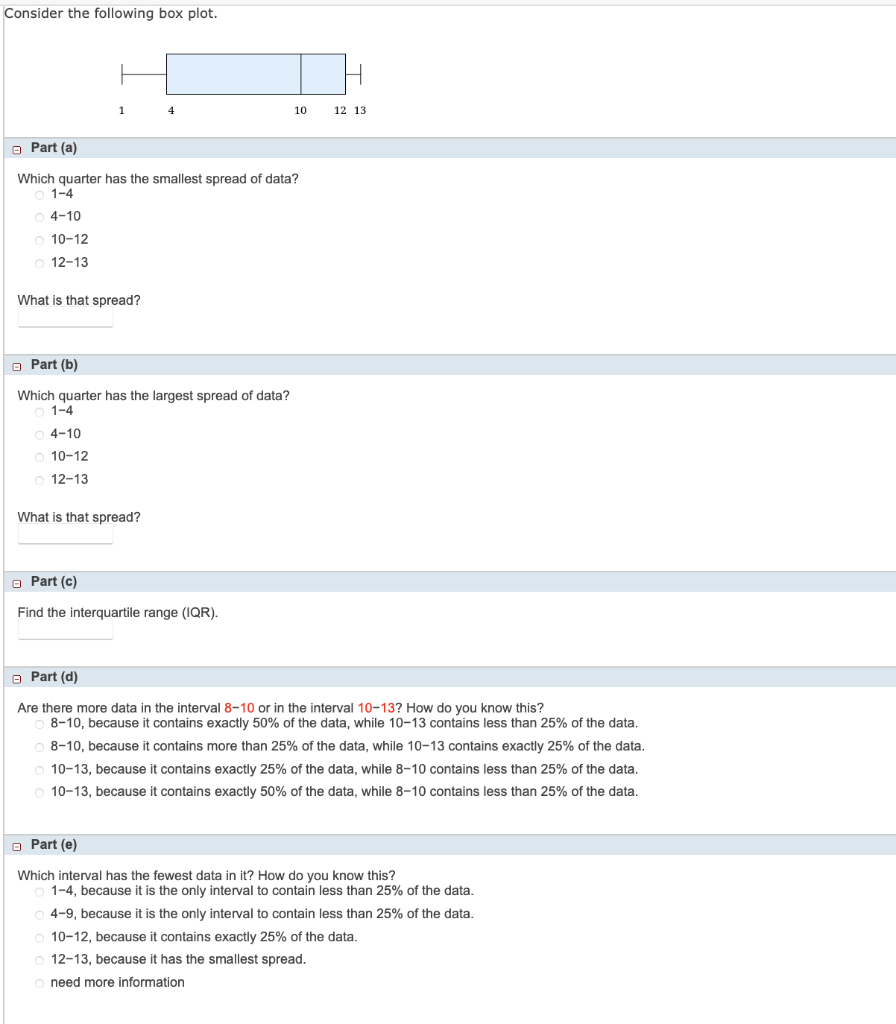
Consider the following box plot. Part (a) Which quarter has the smallest spread of data? \[ \begin{array}{l} 1-4 \\ 4-10 \\ 10-12 \\ 12-13 \end{array} \] What is that spread? Part (b) Which quarter has the largest spread of data? \[ \begin{array}{l} 1-4 \\ 4-10 \\ 10-12 \\ 12-13 \end{array} \] What is that spread? Part (c) Find the interquartile range (IQR). Part (d) Are there more data in the interval \( 8-10 \) or in the interval \( 10-13 \) ? How do you know this? \( 8-10 \), because it contains exactly \( 50 \% \) of the data, while \( 10-13 \) contains less than \( 25 \% \) of the data. 8-10, because it contains more than \( 25 \% \) of the data, while \( 10-13 \) contains exactly \( 25 \% \) of the data. \( 10-13 \), because it contains exactly \( 25 \% \) of the data, while \( 8-10 \) contains less than \( 25 \% \) of the data. 10-13, because it contains exactly \( 50 \% \) of the data, while \( 8-10 \) contains less than \( 25 \% \) of the data. Part (e) Which interval has the fewest data in it? How do you know this? \( 1-4 \), because it is the only interval to contain less than \( 25 \% \) of the data. \( 4-9 \), because it is the only interval to contain less than \( 25 \% \) of the data. \( 10-12 \), because it contains exactly \( 25 \% \) of the data. \( 12-13 \), because it has the smallest spread. need more information
Expert Answer
a) From the box plot, we can see that, the qaurtiles are
