Home /
Expert Answers /
Statistics and Probability /
ceo-data-the-accompanying-data-represent-the-total-compensation-for-12-randomly-selected-chief-ex-pa592
(Solved): CEO Data The accompanying data represent the total compensation for 12 randomly selected chief ex ...
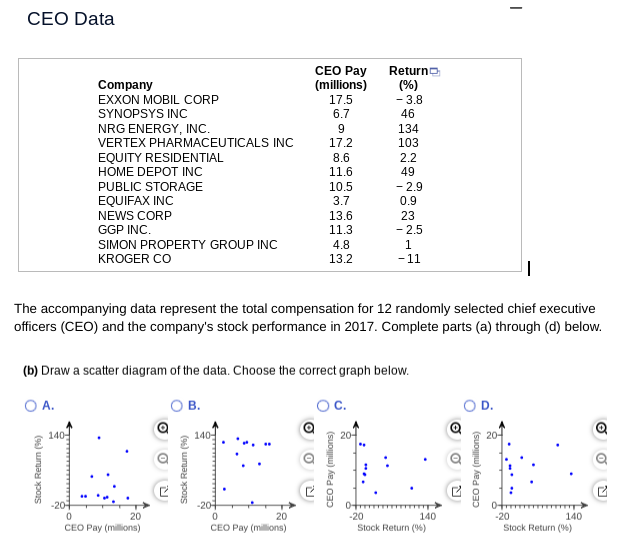
CEO Data The accompanying data represent the total compensation for 12 randomly selected chief executive officers (CEO) and the company's stock performance in 2017. Complete parts (a) through (d) below. (b) Draw a scatter diagram of the data. Choose the correct graph below.
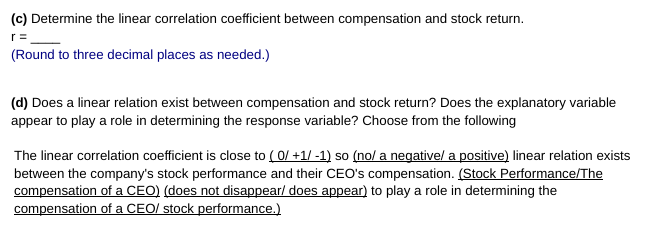
(c) Determine the linear correlation coefficient between compensation and stock return. \( r= \) (Round to three decimal places as needed.) (d) Does a linear relation exist between compensation and stock return? Does the explanatory variable appear to play a role in determining the response variable? Choose from the following The linear correlation coefficient is close to \( (0 /+1 /-1) \) so \( ( \) no/ a negative/ a positive) linear relation exists between the company's stock performance and their CEO's compensation. (Stock Performance/The compensation of a CEO) (does not disappear/ does appear) to play a role in determining the compensation of a \( \mathrm{CEO} / \) stock performance.)
Expert Answer
CEO Data The accompanying data represent the total compensation for 12 randomly selected chief executive officers (CEO) and the company's stock p