Home /
Expert Answers /
Economics /
calculate-the-percentage-change-in-real-gdp-in-each-of-the-years-shown-hint-the-percentage-c-pa382
(Solved): Calculate the percentage change in real GDP in each of the years shown. (Hint: The percentage c ...
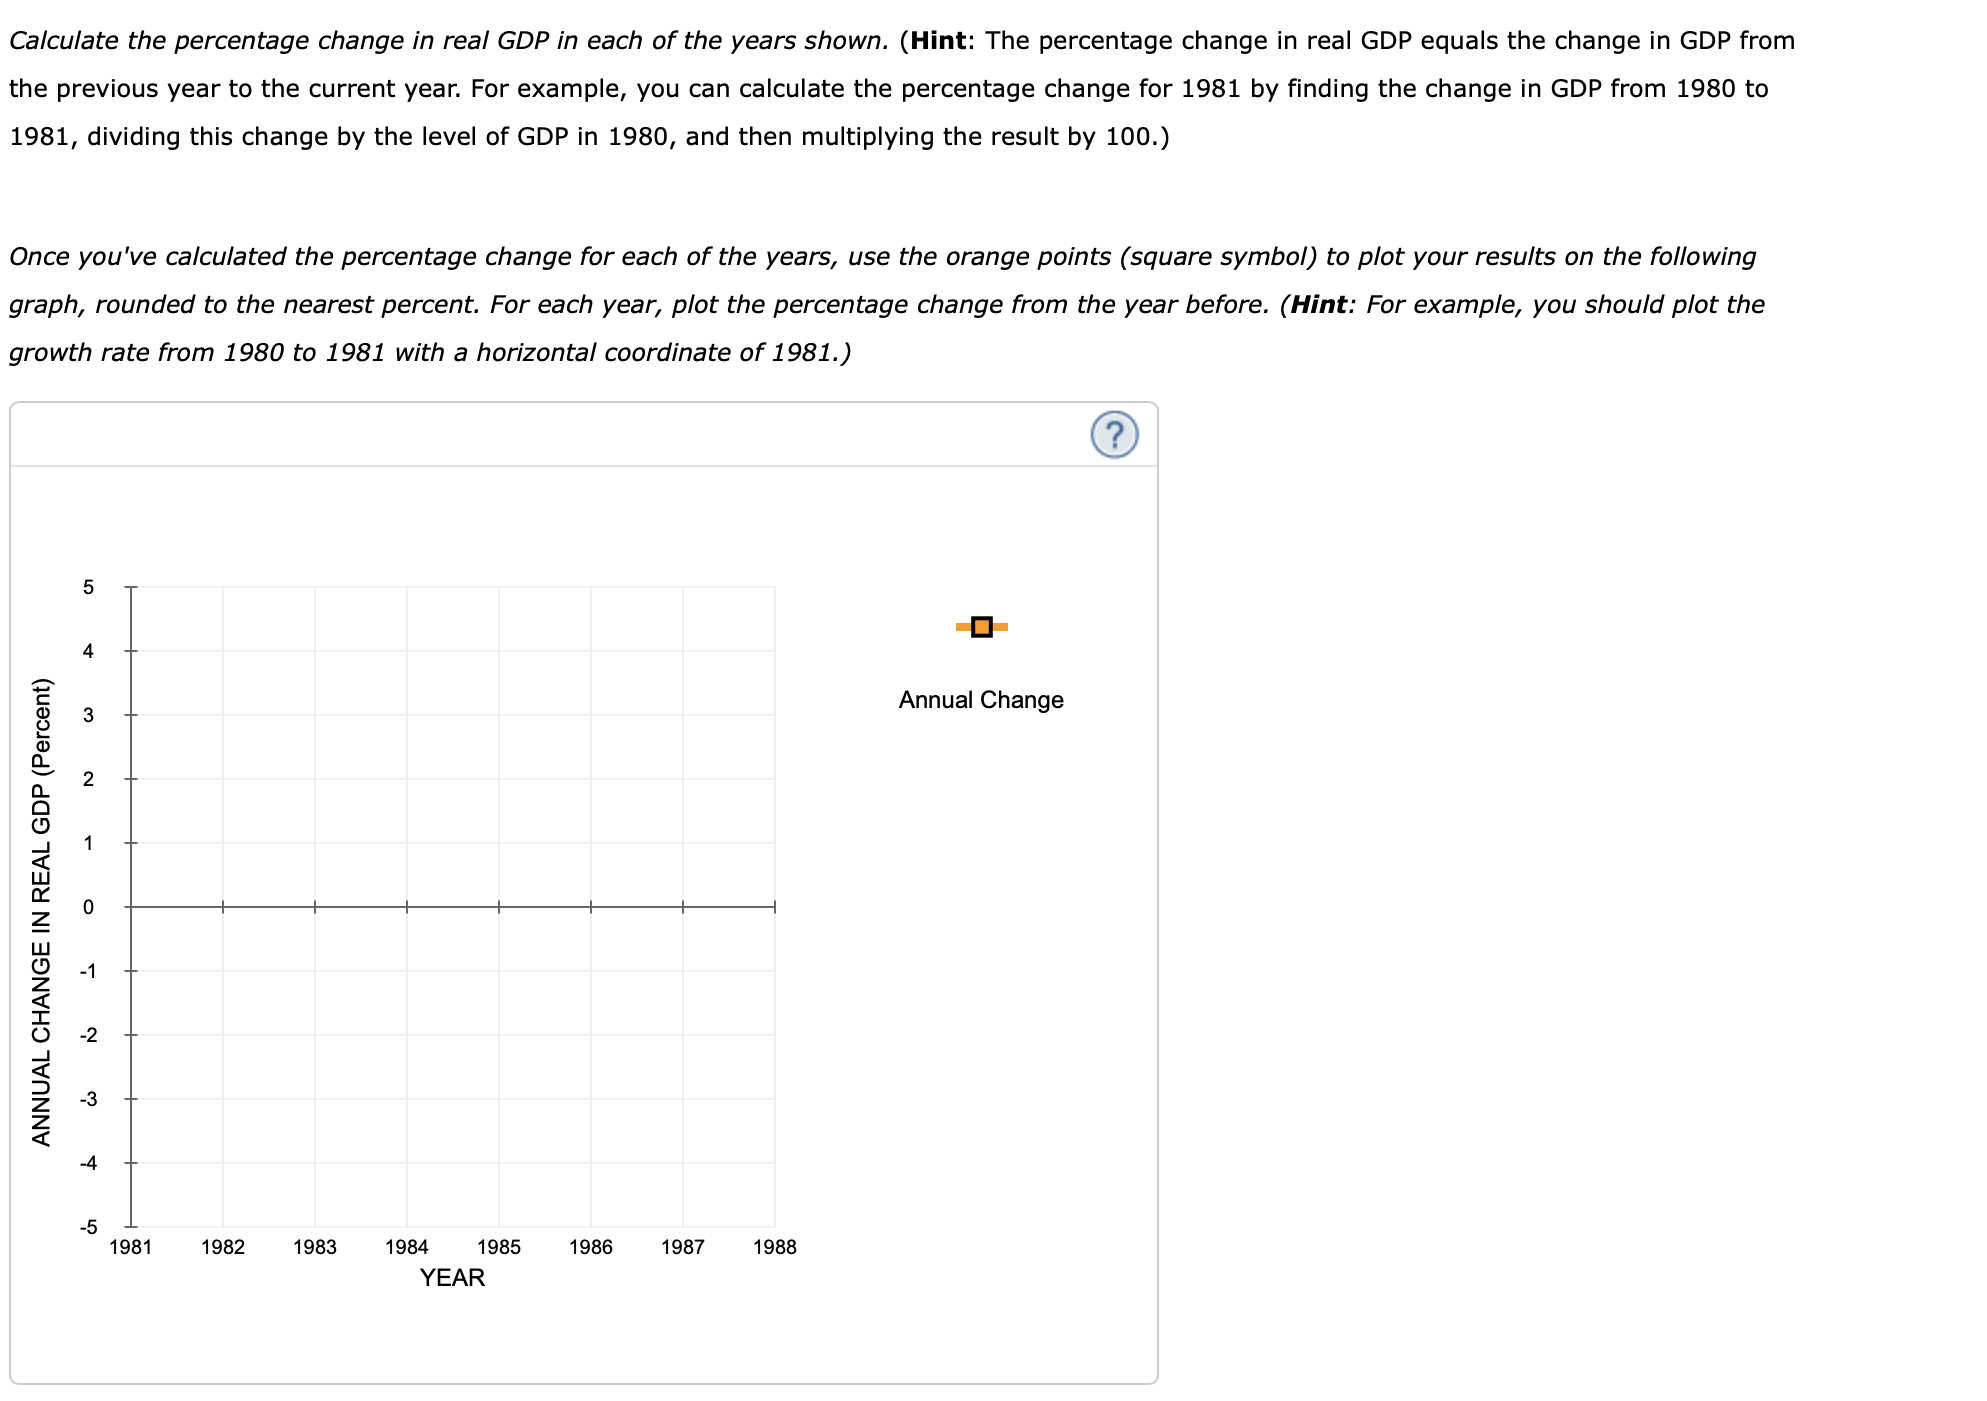
Calculate the percentage change in real GDP in each of the years shown. (Hint: The percentage change in real GDP equals the change in GDP from the previous year to the current year. For example, you can calculate the percentage change for 1981 by finding the change in GDP from 1980 to 1981 , dividing this change by the level of GDP in 1980, and then multiplying the result by 100.) Once you've calculated the percentage change for each of the years, use the orange points (square symbol) to plot your results on the following graph, rounded to the nearest percent. For each year, plot the percentage change from the year before. (Hint: For example, you should plot the growth rate from 1980 to 1981 with a horizontal coordinate of 1981.)
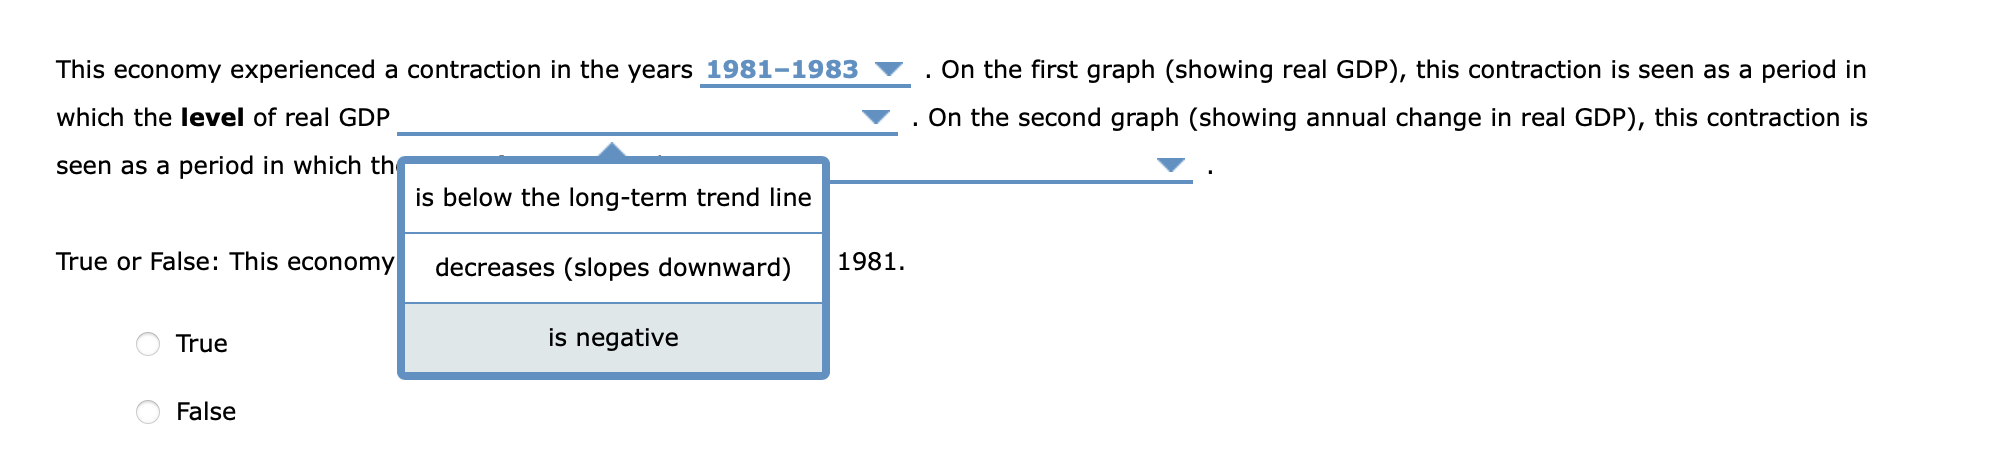
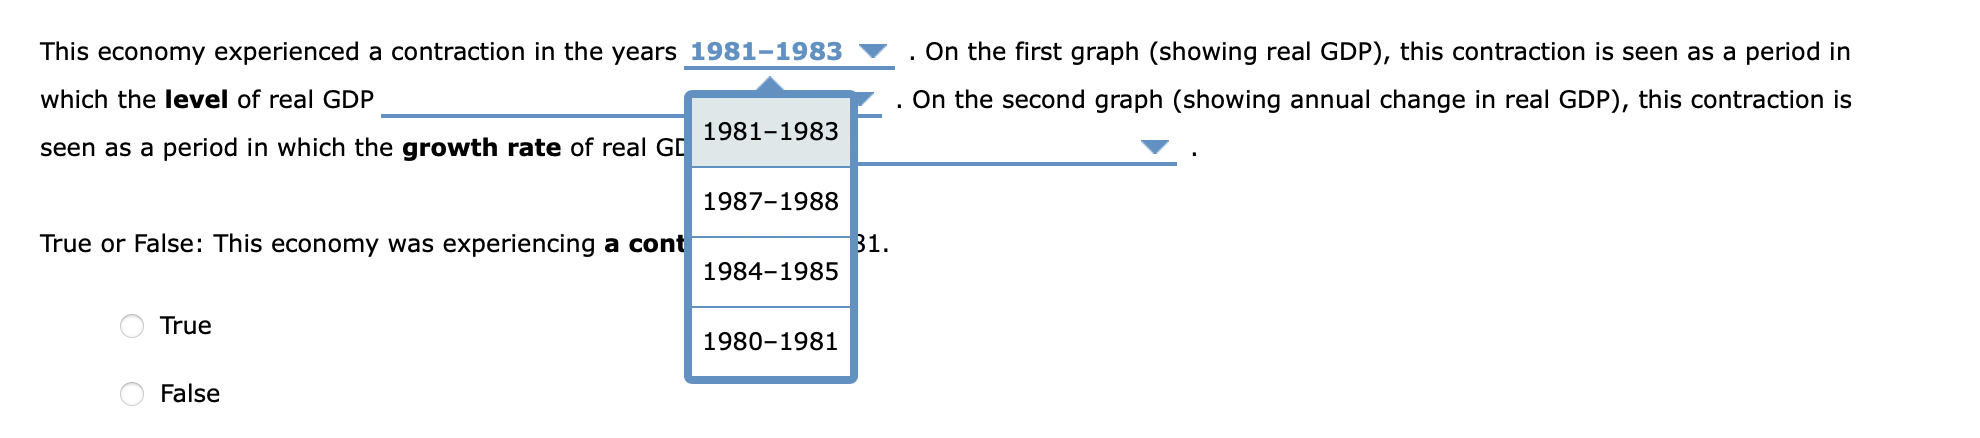
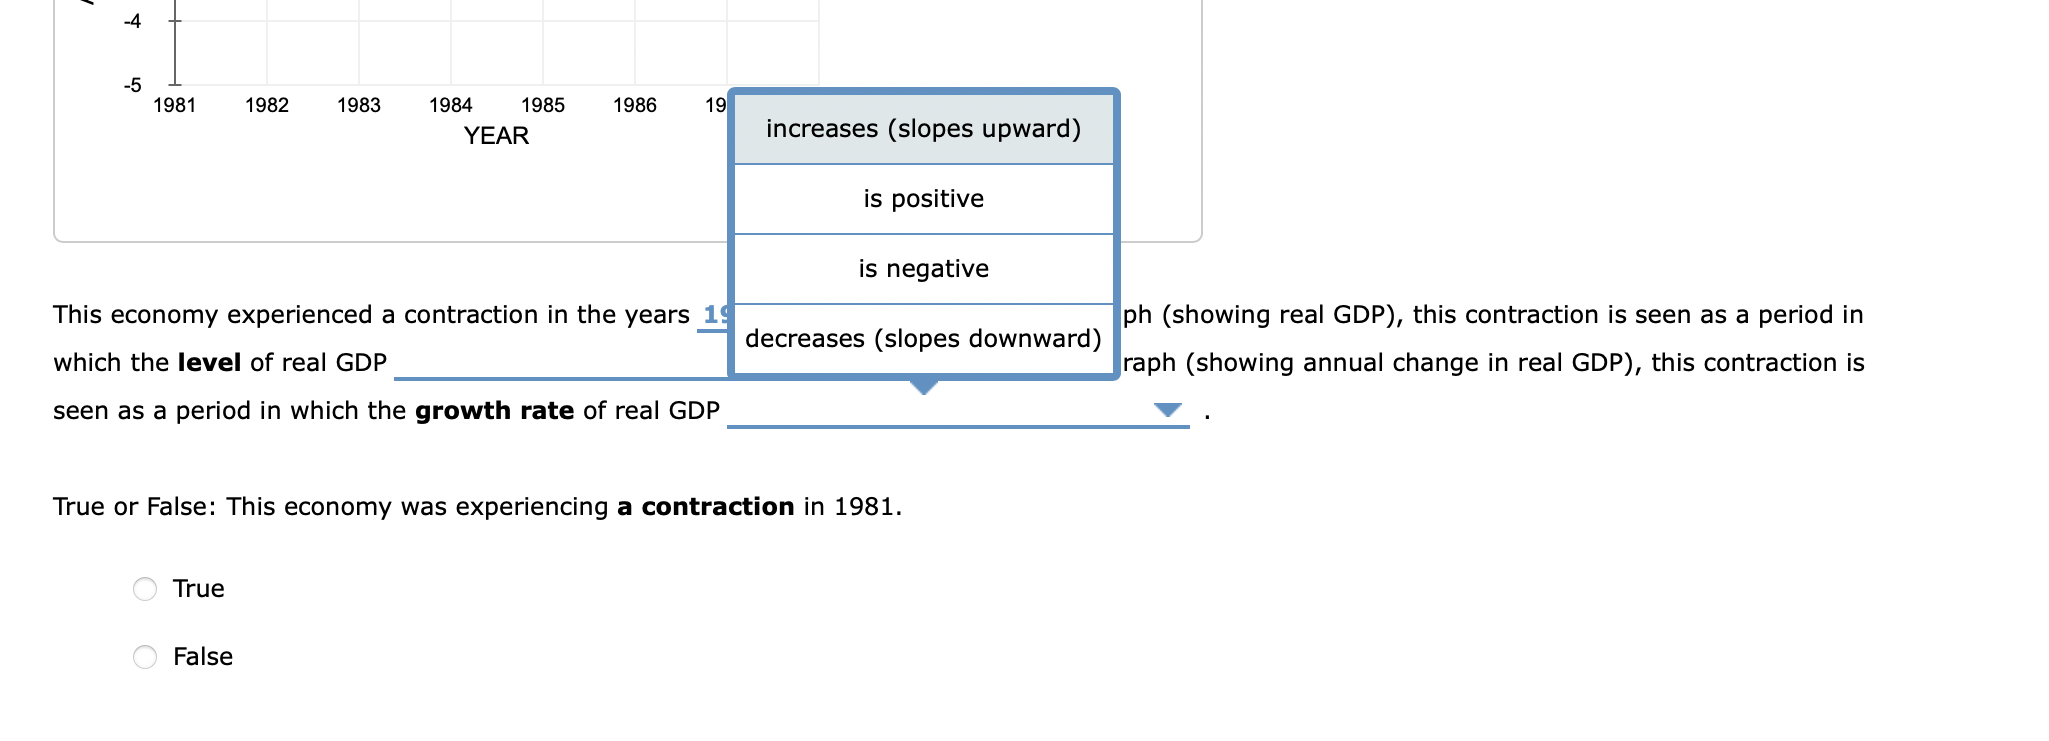
This economy experienced a contraction in the years which the level of real GDP seen as a period in which th True or False: This economy True False . On the first graph (showing real GDP), this contraction is seen as a period in . On the second graph (showing annual change in real GDP), this contraction is 1981.
True False
This economy experienced a contraction in the years which the level of real GDP seen as a period in which the growth rate of real GI True or False: This economy was experiencing a con . On the first graph (showing real GDP), this contraction is seen as a period in . On the second graph (showing annual change in real GDP), this contraction is True False
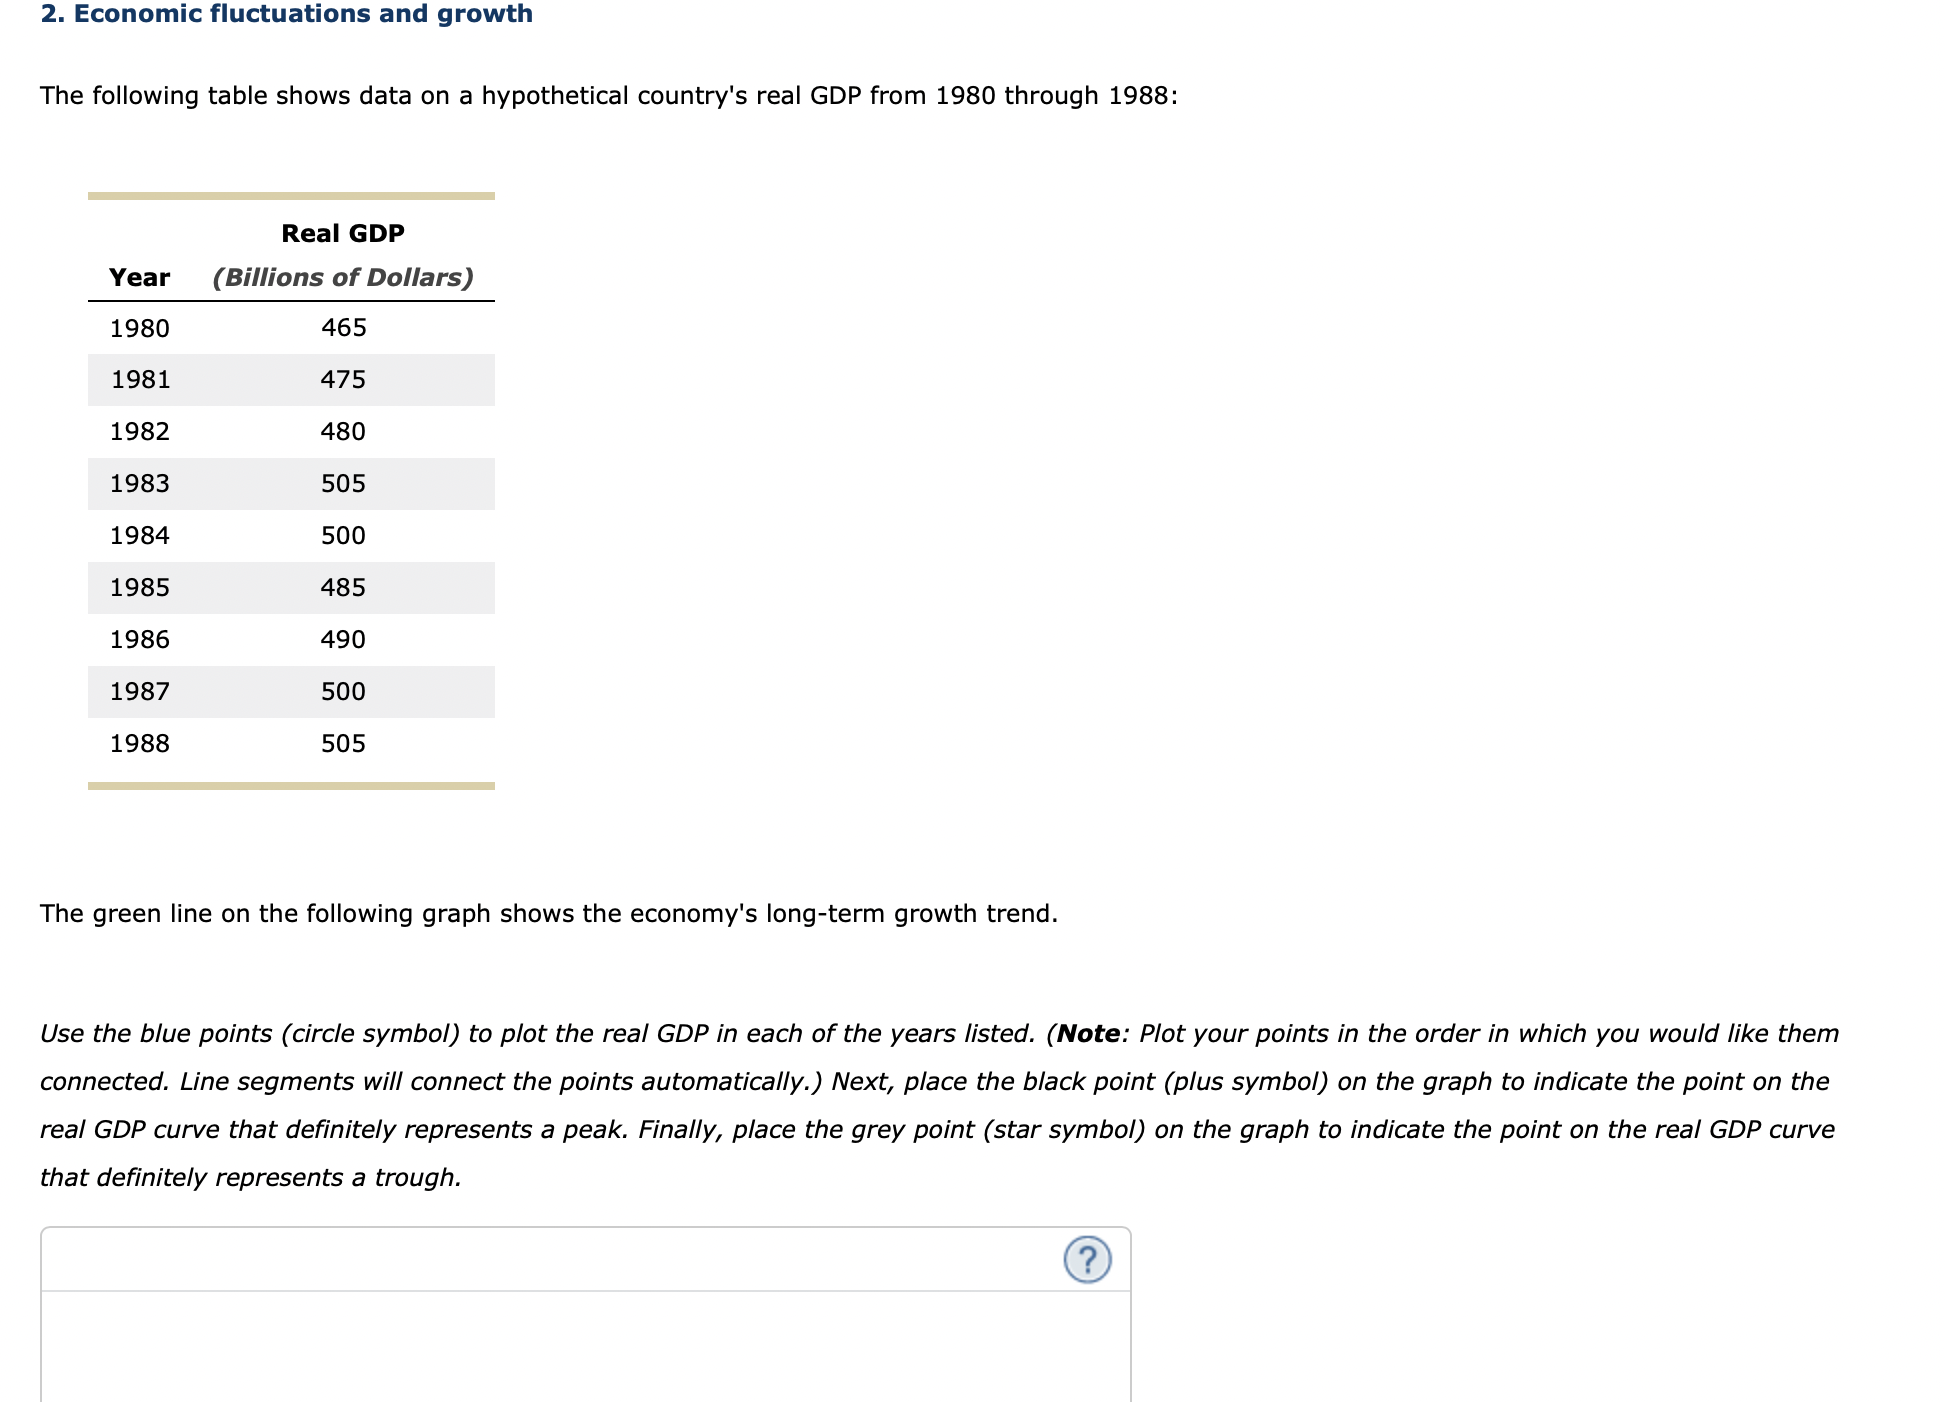
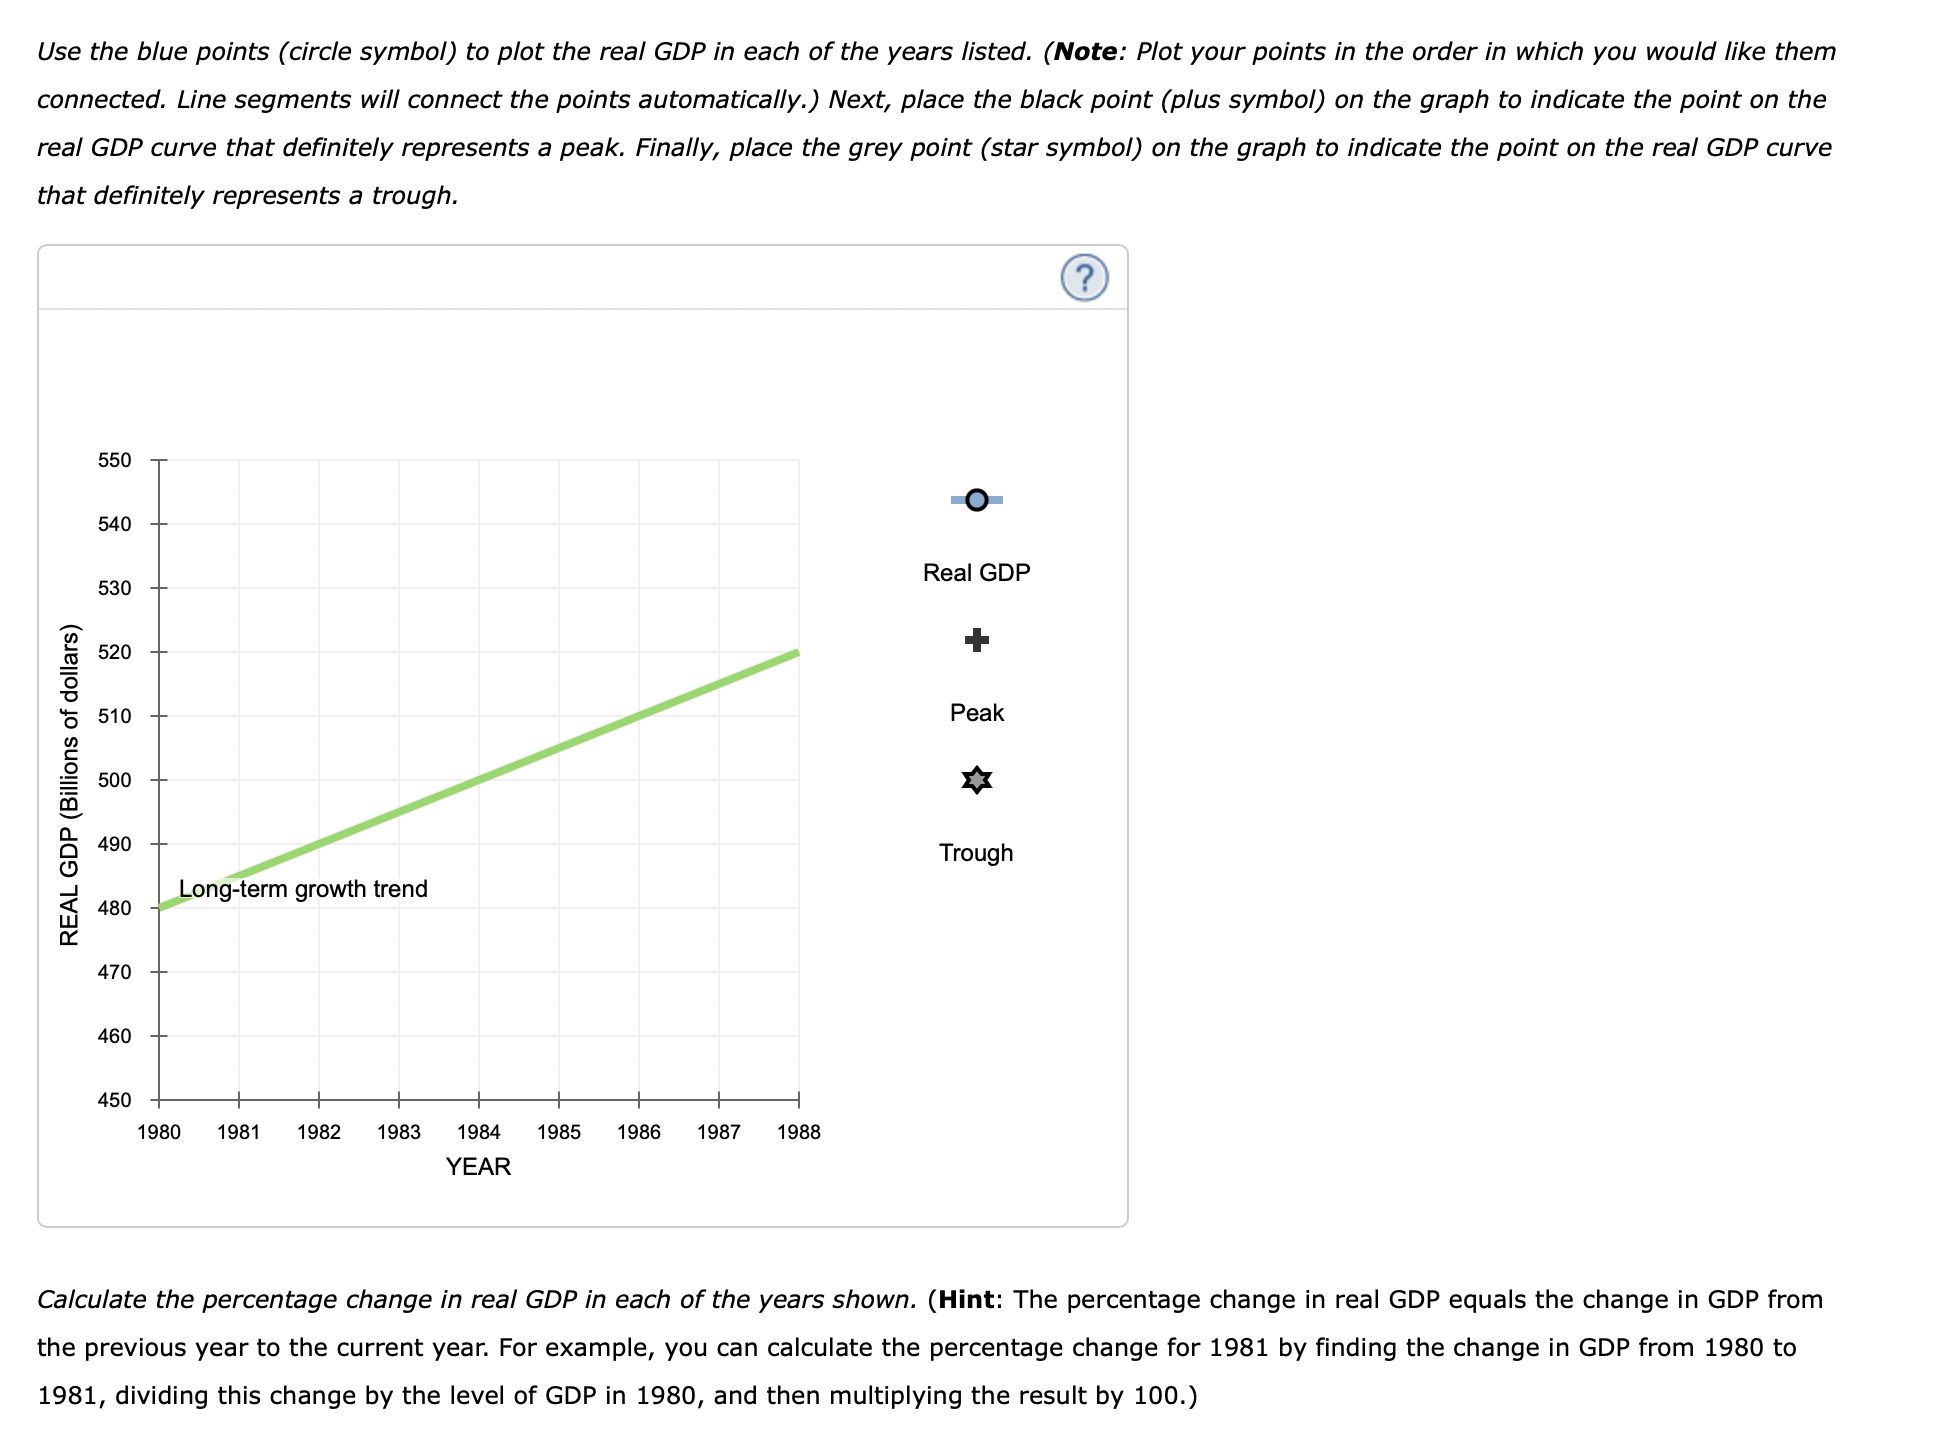
2. Economic fluctuations and growth The following table shows data on a hypothetical country's real GDP from 1980 through 1988: The green line on the following graph shows the economy's long-term growth trend. Use the blue points (circle symbol) to plot the real GDP in each of the years listed. (Note: Plot your points in the order in which you would like them connected. Line segments will connect the points automatically.) Next, place the black point (plus symbol) on the graph to indicate the point on the real GDP curve that definitely represents a peak. Finally, place the grey point (star symbol) on the graph to indicate the point on the real GDP curve that definitely represents a trough.
Use the blue points (circle symbol) to plot the real GDP in each of the years listed. (Note: Plot your points in the order in which you would like them connected. Line segments will connect the points automatically.) Next, place the black point (plus symbol) on the graph to indicate the point on the real GDP curve that definitely represents a peak. Finally, place the grey point (star symbol) on the graph to indicate the point on the real GDP curve that definitely represents a trough. Calculate the percentage change in real GDP in each of the years shown. (Hint: The percentage change in real GDP equals the change in GDP from the previous year to the current year. For example, you can calculate the percentage change for 1981 by finding the change in GDP from 1980 to 1981 , dividing this change by the level of GDP in 1980 , and then multiplying the result by 100. )