Home /
Expert Answers /
Statistics and Probability /
c-nbsp-develop-the-estimated-regression-equation-that-could-be-used-to-predict-the-percentage-of-pa568
(Solved): c. Develop the estimated regression equation that could be used to predict the percentage of ...
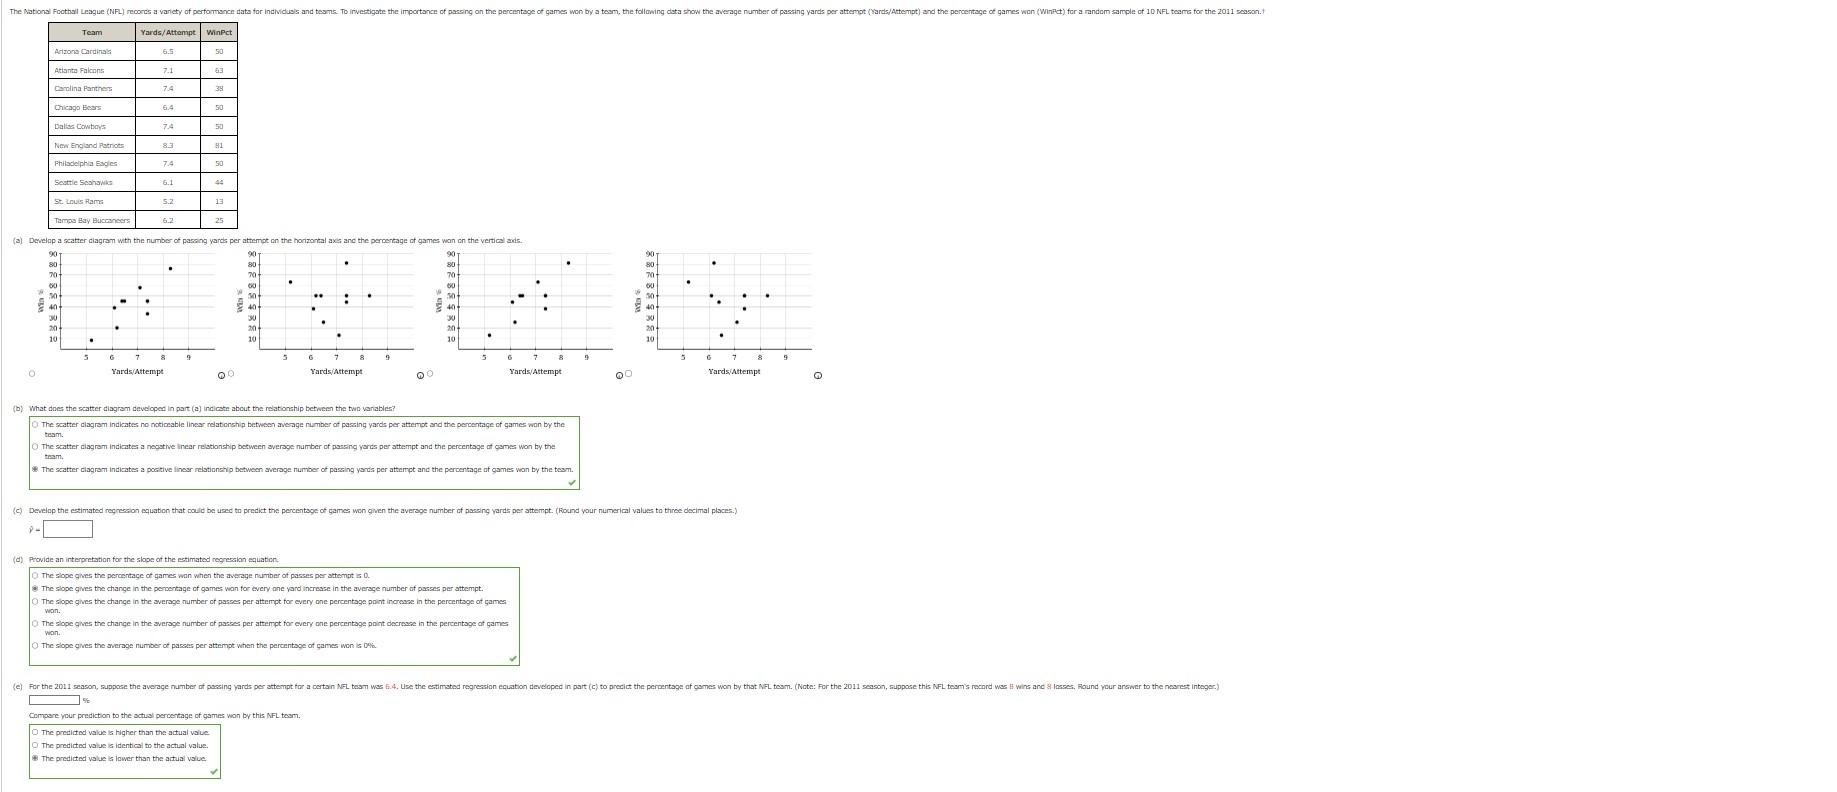
c. Develop the estimated regression equation that could be used to predict the percentage of games won given the average number of passing yards per attempt. (Round your numerical values to three decimal places.)
y=
e. For the 2011 season, suppose the average number of passing yards per attempt for a certain NFL team was 6.4. Use the estimated regression equation developed in part (c) to predict the percentage of games won by that NFL team. (Note: For the 2011 season, suppose this NFL team's record was 8 wins and 8 losses. Round your answer to the nearest integer.)
= %
(b) What dnes the seatter diagram developed in part (a) inclicate abcut the reationship between the two vanables? The scatter clagrom indicates no notioeabie lines relatenship betwoen avesage number of paszing yards per attemot and the percentage of games wan by the tesm. The scatter diagram indicates a nogsthe inear restionship between aversge number of paesing yarts per attempt and the percentsge cif esmes won by the twam, - The scatter ciagramindiates a poative linesr relotionship between sweroge number of passing yordis per attempt and the percentage uf games won by the tesm. (c) Develap the estimated regresaion equation that pould be used to predit the pereentage of games wen given the aversge number of pasang yards per attempt. (fiound yo \( \hat{4} \) (d) Provide an interpretation for the slope of the estimated regresaian equation. The slope gives the percentage of games wan when the avercge number of passes per steompt is 0 . The slope gives the change in the perportage of games wan for every ane yard incresse in the average number of passes per attempt. The slope gives the change in the swerage number of passes per attempt foe every ane percentoge point inoresae in the percentsge of games won. The slope gives the change in the averoge number of passes per attempt for every ane percentage point decresoe in the percentsge at games won. The siope gives the average number of paseas per attempt when the parcentsge of games won is deis.
Expert Answer
a) Excel input data for plotting : Yards/Attempt WinPct 6.5 50 7.1 63 7.4 38 6.4 50 7.4 50 8.3 81 7.4 50 6.1 44 5.2 13 6.2 25 For plotting : After sto
