Home /
Expert Answers /
Computer Science /
busi-6361-excel-assigment-7-q1-q2-q3-q4-begin-tabular-c-c-c-c-c-c-c-hline-p-pa754
(Solved): BUSI 6361 - Excel Assigment 7 q1:q2:q3:q4: \begin{tabular}{|c|c|c|c|c|c|c|} \hline & P ...
BUSI 6361 - Excel Assigment 7
q1:
q2:
q3:
q4:
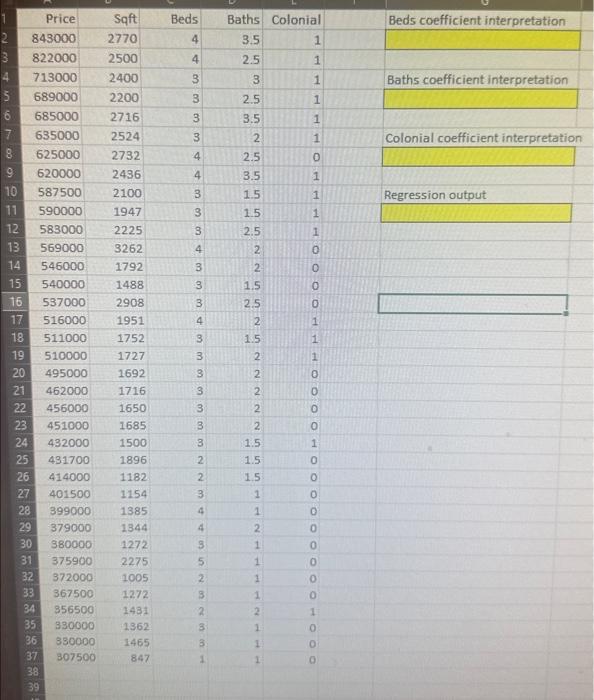
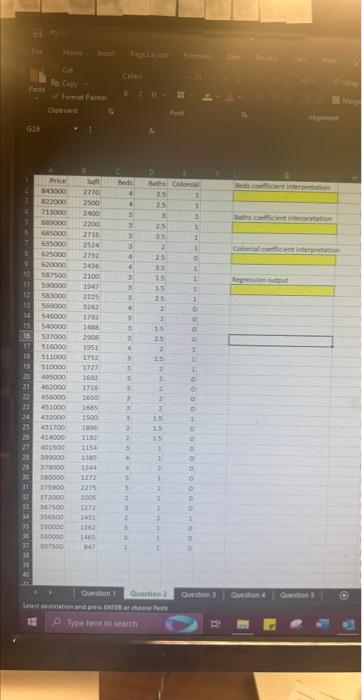
\begin{tabular}{|c|c|c|c|c|c|c|} \hline & Price & Sqft & Beds & Baths & Colonial & Beds coefficient interpretation \\ \hline & 843000 & 2770 & 4 & 3.5 & 1 & \\ \hline 3 & 822000 & 2500 & 4 & 2.5 & 1 & \\ \hline 4 & 713000 & 2400 & 3 & 3 & 1 & Baths coefficient interpretation \\ \hline 5 & 689000 & 2200 & 3 & 2.5 & 1 & \\ \hline 6 & 685000 & 2716 & 3 & 3.5 & 1 & \\ \hline 7 & 635000 & 2524 & 3 & 2 & 1 & Colonial coefficient interpretatio \\ \hline 8 & 625000 & 2732 & 4 & 2.5 & 0 & \\ \hline 9 & 620000 & 2436 & 4 & 3.5 & 1 & \\ \hline 10 & 587500 & 2100 & 3 & 1.5 & 1 & Regression output \\ \hline 11 & 590000 & 1947 & 3 & 1.5 & 1 & \\ \hline 12 & 583000 & 2225 & 3 & 2.5 & 1 & \\ \hline 13 & 569000 & 3262 & 4 & 2 & 0 & \\ \hline 14 & 546000 & 1792 & 3 & 2 & 0 & \\ \hline 15 & 540000 & 1488 & 3 & 1.5 & 0 & \\ \hline 16 & 537000 & 2908 & 3 & 2.5 & 0 & \\ \hline 17 & 516000 & 1951 & 4 & 2 & 1 & \\ \hline 18 & 511000 & 1752 & 3 & 1.5 & 1 & \\ \hline 19 & 510000 & 1727 & 3 & 2 & 1 & \\ \hline 20 & 495000 & 1692 & 3 & 2 & 0 & \\ \hline 21 & 462000 & 1716 & 3 & 2 & 0 & \\ \hline 22 & 456000 & 1650 & 3 & 2 & 0 & \\ \hline 23 & 451000 & 1685 & 3 & 2 & 0 & \\ \hline 24 & 432000 & 1500 & 3 & 1.5 & 1 & 4 \\ \hline 25 & 431700 & 1896 & 2 & 1.5 & 0 & \\ \hline 26 & 414000 & 1182 & 2 & 1.5 & 0 & \\ \hline 27. & 401500 & 1154 & 3 & 1 & 0 & \\ \hline 28 & 399000 & 1385 & 4 & 1 & 0 & \\ \hline 29 & 379000 & 1344 & 4 & 2 & 0 & \\ \hline 30 & 380000 & 1272 & 3 & 1 & 0 & \\ \hline 31 & 375900 & 2275 & 5 & 1 & 0 & \\ \hline 32 & 372000 & 1005 & 2 & 1 & 0 & \\ \hline 33 & 367500 & 1272 & 3 & 1 & 0 & \\ \hline 34 & 356500 & 1431 & 2 & 2 & 1 & \\ \hline 35 & 330000 & 1362 & 3 & 1 & 0 & \\ \hline 36 & 380000 & 1465 & 3 & 1 & 0 & \\ \hline 37. & 307500 & 847 & 1 & 1 & 0 & \\ \hline \begin{tabular}{l} 38 \\ 39 \end{tabular} & & & & & & \\ \hline \end{tabular}
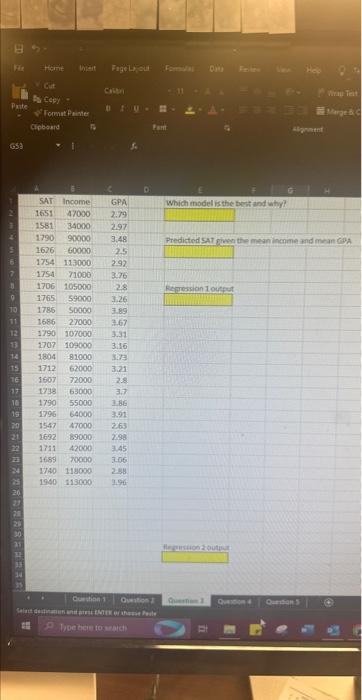
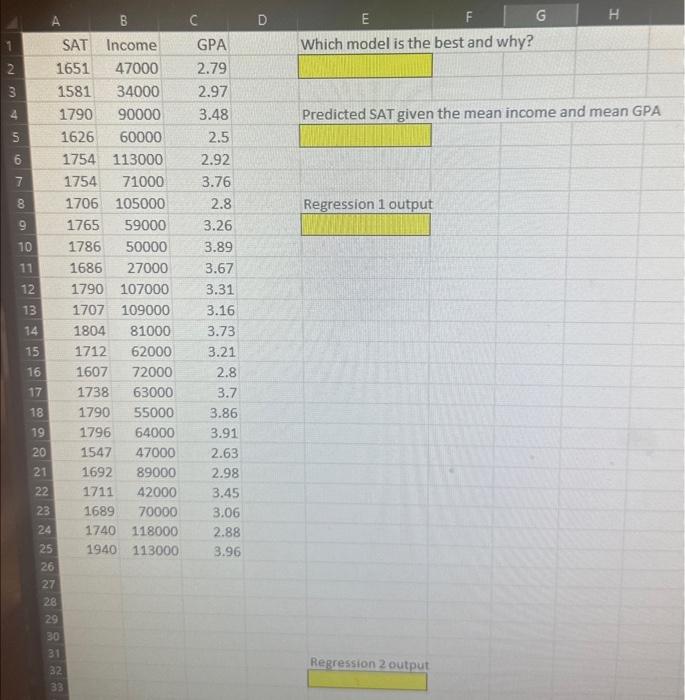
\begin{tabular}{|r|r|r|r|} \hline 1 & SAT & Income & GPA \\ \hline 2 & 1651 & 47000 & 2.79 \\ \hline 3 & 1581 & 34000 & 2.97 \\ \hline 4 & 1790 & 90000 & 3.48 \\ \hline 5 & 1626 & 60000 & 2.5 \\ \hline 6 & 1754 & 113000 & 2.92 \\ \hline 7 & 1754 & 71000 & 3.76 \\ \hline 8 & 1706 & 105000 & 2.8 \\ \hline 9 & 1765 & 59000 & 3.26 \\ \hline 10 & 1786 & 50000 & 3.89 \\ \hline 11 & 1686 & 27000 & 3.67 \\ \hline 12 & 1790 & 107000 & 3.31 \\ \hline 13 & 1707 & 109000 & 3.16 \\ \hline 14 & 1804 & 81000 & 3.73 \\ \hline 15 & 1712 & 62000 & 3.21 \\ \hline 16 & 1607 & 72000 & 2.8 \\ \hline 17 & 1738 & 63000 & 3.7 \\ \hline 18 & 1790 & 55000 & 3.86 \\ \hline 19 & 1796 & 64000 & 3.91 \\ \hline 20 & 1547 & 47000 & 2.63 \\ \hline 21 & 1692 & 89000 & 2.98 \\ \hline 22 & 1711 & 42000 & 3.45 \\ \hline 23 & 1689 & 70000 & 3.06 \\ \hline 24 & 1740 & 118000 & 2.88 \\ \hline 25 & 1940 & 113000 & 3.96 \\ \hline & & & \\ \hline \end{tabular} Which model is the best and why? Predicted SAT given the mean income and mean GPA Regression 1 output
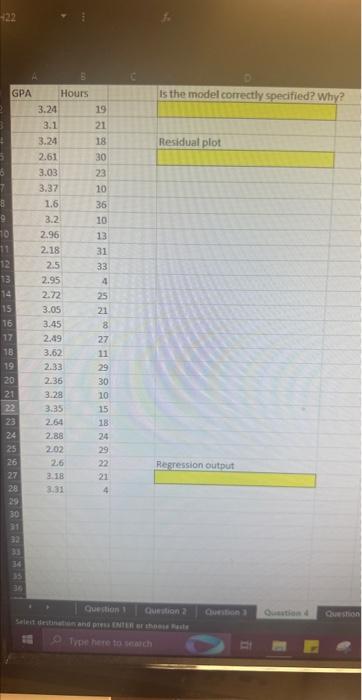
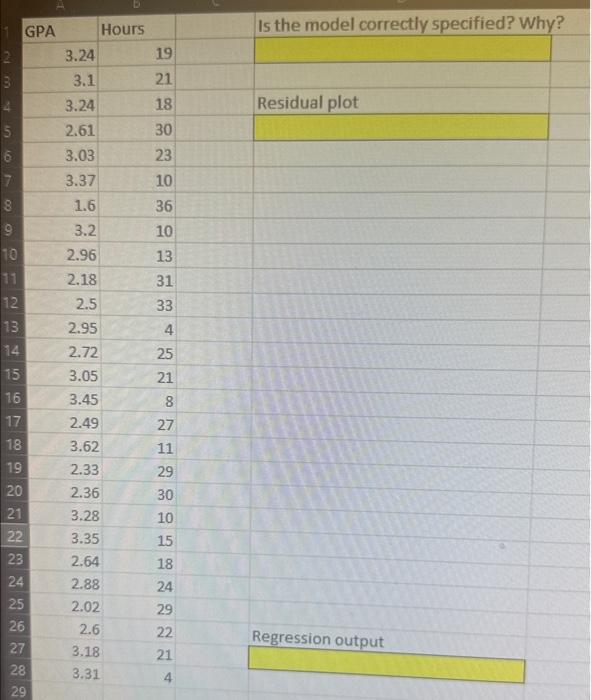
GPA Hours Is the model correctly specified? Why? 3.24 19 3.1 21 3.24 18 Residual plot 2.61 30 3.03 23 3.37 10 1.6 36 3.2 10 2.96 13 2.18 31. 2.5 33 2.95 4 2.72 25 3.05 21 3.45 8 2.49 27 3.62 11 2.33 29 2.36 30 3.28 10 3.35 15 2.64 18 2.88 24 2.02 29 2.6 22 Regression output 3.18 21 3.31 4 Residual plot