Home /
Expert Answers /
Biology /
biostatistics-questions-graph-below-represents-what-type-of-correlation-a-weak-positive-correlatio-pa496
(Solved): Biostatistics questions graph below represents what type of correlation: a. weak positive correlatio ...
Biostatistics questions
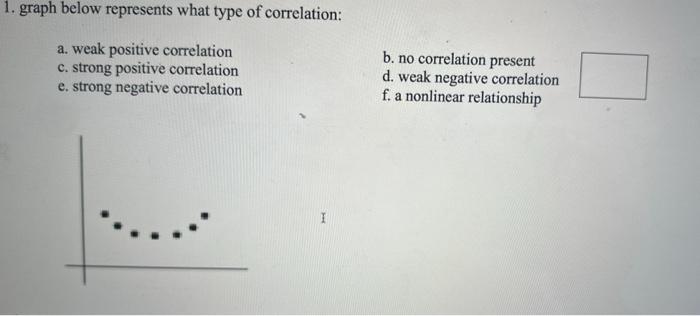
graph below represents what type of correlation: a. weak positive correlation c. strong positive correlation e. strong negative correlation b. no correlation present d. weak negative correlation f. a nonlinear relationship
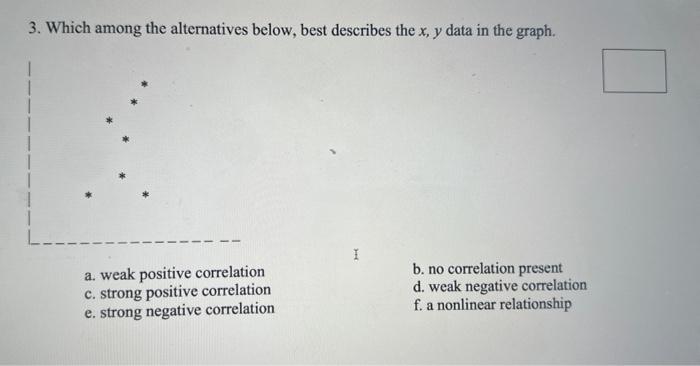
3. Which among the alternatives below, best describes the data in the graph. a. weak positive correlation c. strong positive correlation e. strong negative correlation b. no correlation present d. weak negative correlation f. a nonlinear relationship
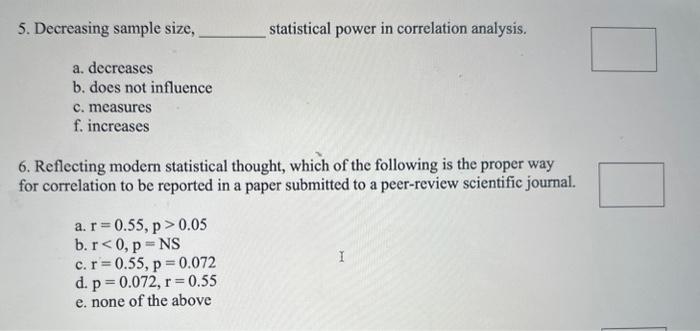
5. Decreasing sample size, statistical power in correlation analysis. a. decreases b. does not influence c. measures . increases 6. Reflecting modern statistical thought, which of the following is the proper way for correlation to be reported in a paper submitted to a peer-review scientific journal. a. b. c. d. e. none of the above
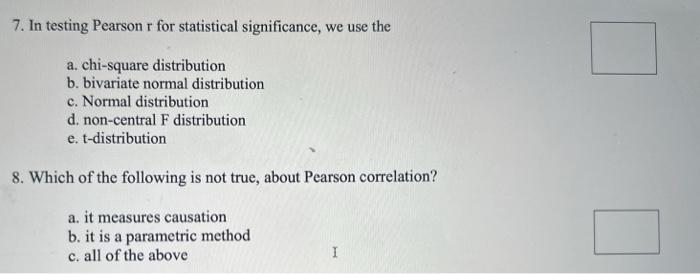
7. In testing Pearson for statistical significance, we use the a. chi-square distribution b. bivariate normal distribution c. Normal distribution d. non-central distribution e. -distribution 8. Which of the following is not true, about Pearson correlation? a. it measures causation b. it is a parametric method c. all of the above I
10. In a one-sided correlation test, the p-value In a two-sided correlation test on the same data, ? a. 0.015 b. 0.03 c. 0.006 d. 0.10 11. When testing Pearson for significance, the alternate hypothesis is a. is small b. is large c. -square is d. is not zero e. -square is f. is invalid g. is zero