Home /
Expert Answers /
Earth Sciences /
biodiversity-in-the-table-data-for-some-caribbean-islands-is-listed-the-approximate-surface-area-pa462
(Solved): Biodiversity. In the table, data for some Caribbean islands is listed: the approximate surface area ...

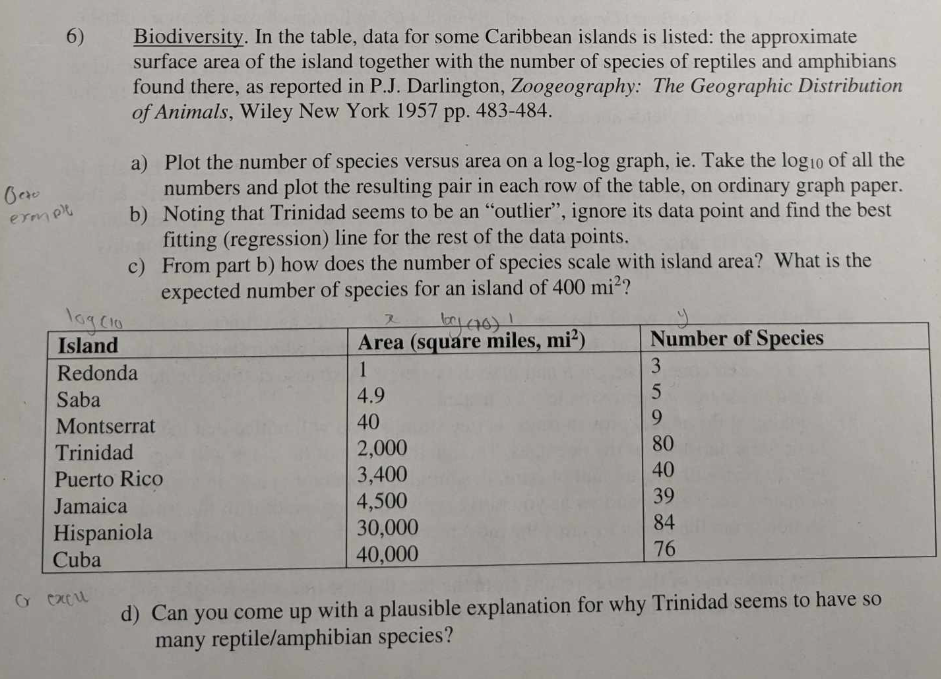
6) Biodiversity. In the table, data for some Caribbean islands is listed: the approximate surface area of the island together with the number of species of reptiles and amphibians found there, as reported in P.J. Darlington, Zoogeography: The Geographic Distribution of Animals, Wiley New York 1957 pp. 483-484. a) Plot the number of species versus area on a -log graph, ie. Take the of all the numbers and plot the resulting pair in each row of the table, on ordinary graph paper. b) Noting that Trinidad seems to be an "outlier", ignore its data point and find the best fitting (regression) line for the rest of the data points. c) From part b) how does the number of species scale with island area? What is the expected number of species for an island of ? d) Can you come up with a plausible explanation for why Trinidad seems to have so many reptile/amphibian species?