Home /
Expert Answers /
Algebra /
below-is-a-graph-that-depicts-a-typical-depreciation-curve-based-on-vehicle-mileage-let-v-m-pa196
(Solved): Below is a graph that depicts a typical depreciation curve based on vehicle mileage. Let \( V(m) \) ...
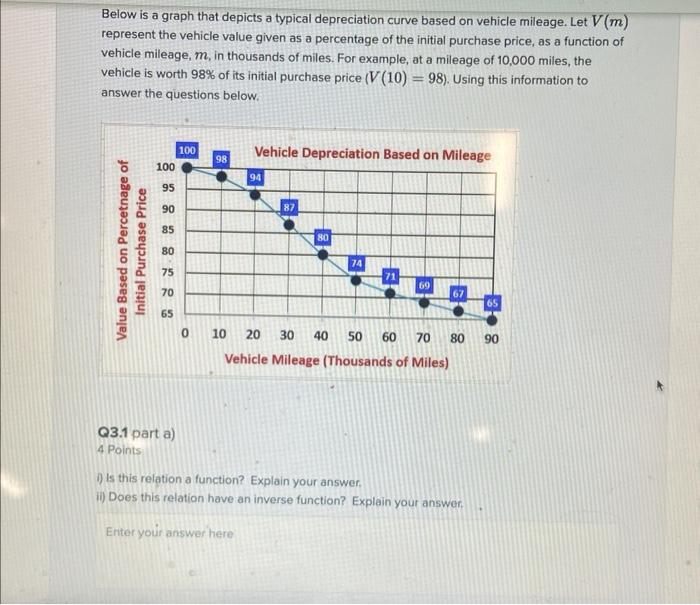
Below is a graph that depicts a typical depreciation curve based on vehicle mileage. Let \( V(m) \) represent the vehicle value given as a percentage of the initial purchase price, as a function of vehicle mileage, \( m \), in thousands of miles. For example, at a mileage of 10,000 miles, the vehicle is worth \( 98 \% \) of its initial purchase price \( (V(10)=98) \). Using this information to answer the questions below. Q3.1 part a) 4 Points i) Is this relation a function? Explain your answer. ii) Does this relation have an inverse function? Explain your answer. Enter yoúr answer here
Expert Answer
To determine whether the graph below is that of a function or not and find if the inverse exists .