Home /
Expert Answers /
Other Math /
below-is-a-graph-of-a-normal-distribution-with-mean-mu-2-and-standard-deviation-sigma-4-pa909
(Solved): Below is a graph of a normal distribution with mean \( \mu=2 \) and standard deviation \( \sigma=4 ...
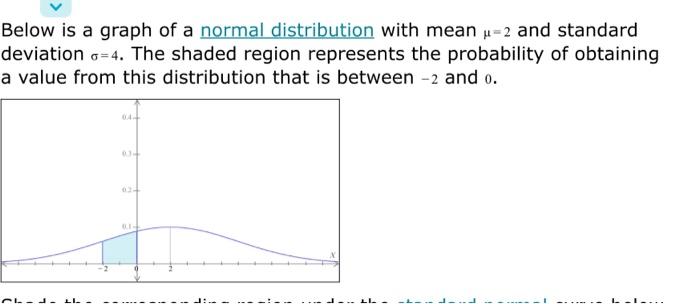
Below is a graph of a normal distribution with mean \( \mu=2 \) and standard deviation \( \sigma=4 \). The shaded region represents the probability of obtaining a value from this distribution that is between \( -2 \) and 0 .
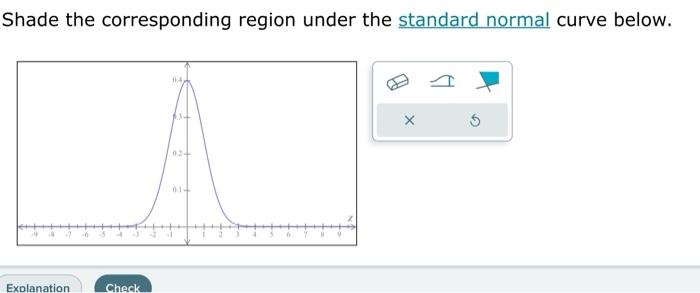
Shade the corresponding region under the standard normal curve below.