Home /
Expert Answers /
Statistics and Probability /
begin-tabular-l-l-l-sheet1-sheet2-sheet3-hline-end-tabular-a-he-b-a-begin-tabular-pa257
(Solved): \begin{tabular}{|l|l|l|} Sheet1 & Sheet2 & Sheet3 \\ \hline \end{tabular} A he B a. \begin{tabular} ...
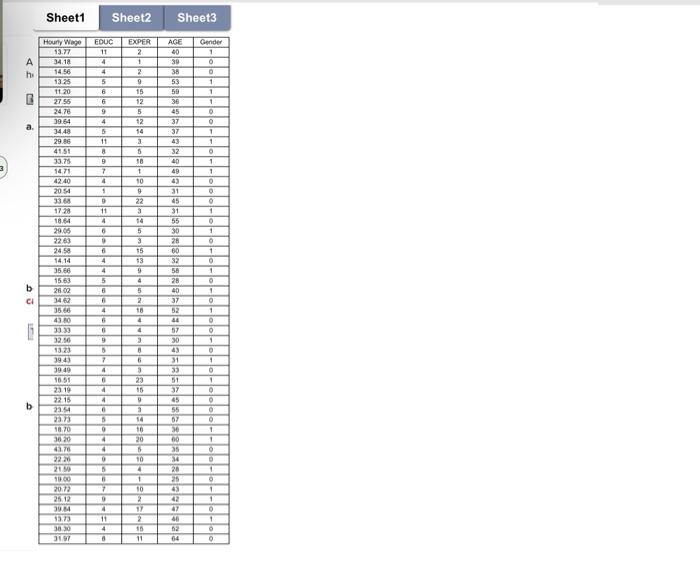
\begin{tabular}{|l|l|l|} Sheet1 & Sheet2 & Sheet3 \\ \hline \end{tabular} A he B a. \begin{tabular}{|c|c|c|c|c|} \hline Hount Waye & EOUC & EXPER & ACE & Gender \\ \hline \( 13.77 \) & 11 & 2 & 40 & 1 \\ \hline \( 14.18 \) & 4 & 1 & 39 & 0 \\ \hline \( 14.56 \) & 4 & 2 & 36 & 0 \\ \hline \( 13.25 \) & 5 & 9 & 53 & 1 \\ \hline 1120 & 6 & 15 & 59 & 1 \\ \hline \end{tabular} \begin{tabular}{|c|c|c|c|c|} \hline 1456 & 4 & 2 & 35 & 0 \\ \hline \( 13.25 \) & 5 & 9 & 53 & 1 \\ \hline 1120 & 6 & 15 & 59 & 1 \\ \hline 2755 & 6 & 12 & 36 & 1 \\ \hline 2476 & 9 & 5 & 45 & 0 \\ \hline \end{tabular} b Cl \begin{tabular}{|c|c|c|c|c|} \hline 2755 & 6 & 12 & 36 & 1 \\ \hline \( 24.76 \) & 9 & 5 & 45 & 0 \\ \hline \( 39.64 \) & 4 & 12 & 37 & 0 \\ \hline \( 34.49 \) & 5 & 14 & 37 & 1 \\ \hline \( 29.86 \) & 11 & 3 & 43 & 1 \\ \hline \( 41.51 \) & 8 & 5 & 32 & 0 \\ \hline \( 13.75 \) & 9 & 18 & 40 & \\ \hline \end{tabular} \begin{tabular}{|l|l|} \hline 49 & 1 \\ \hline 43 & 1 \\ \hline 11 & 0 \\ \hline \end{tabular} b
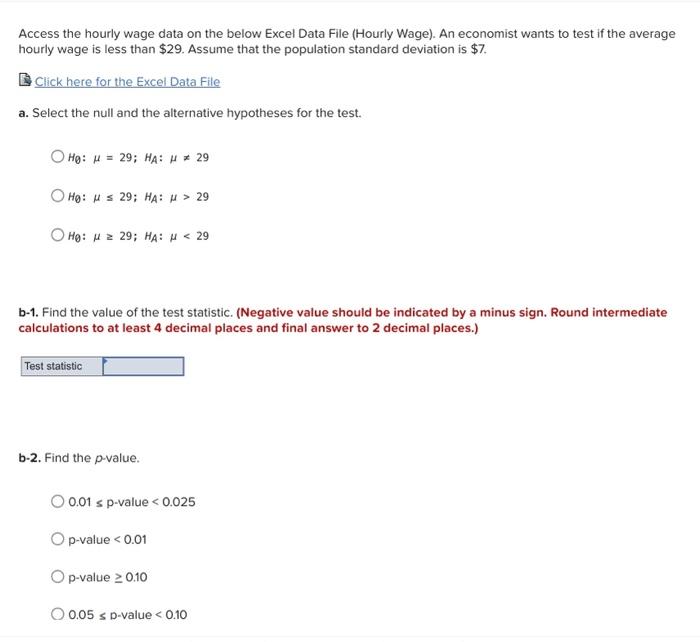
Access the hourly wage data on the below Excel Data File (Hourly Wage). An economist wants to test if the average hourly wage is less than \( \$ 29 \). Assume that the population standard deviation is \( \$ 7 \). Click here for the Excel Data File a. Select the null and the alternative hypotheses for the test. \[ \begin{array}{l} H_{0}: \mu=29 ; H_{A}: \mu \neq 29 \\ H_{0}: \mu \leq 29 ; H_{A}: \mu>29 \\ H_{0}: \mu \geq 29 ; H_{A}: \mu<29 \end{array} \] b-1. Find the value of the test statistic. (Negative value should be indicated by a minus sign. Round intermediate calculations to at least 4 decimal places and final answer to 2 decimal places.) b-2. Find the p-value. \[ \begin{array}{l} 0.01 \leq \mathrm{p} \text {-value }<0.025 \\ \mathrm{p} \text {-value }<0.01 \\ \text { p-value } \geq 0.10 \\ 0.05 \leq \text { p-value }<0.10 \end{array} \]
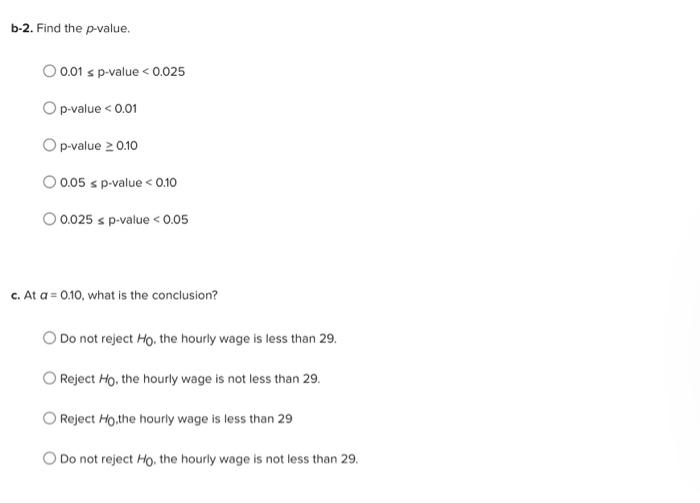
b-2. Find the p-value. \[ \begin{array}{l} 0.01 \leq \mathrm{p} \text {-value }<0.025 \\ \text { p-value }<0.01 \\ \text { p-value } \geq 0.10 \\ 0.05 \leq \mathrm{p} \text {-value }<0.10 \\ 0.025 \leq \mathrm{p} \text {-value }<0.05 \end{array} \] c. At \( a=0.10 \), what is the conclusion? Do not reject \( H_{0} \), the hourly wage is less than 29. Reject \( \mathrm{H}_{\mathrm{O}} \), the hourly wage is not less than 29. Reject \( H_{0} \), the hourly wage is less than 29 Do not reject \( \mathrm{H}_{0} \), the hourly wage is not less than 29.
Expert Answer
Consider that an economist wants to test if the average hourly wage is less than $29. The population standard deviation is givne to be $7. a. The null