Home /
Expert Answers /
Statistics and Probability /
b-what-does-the-scatter-diagram-developed-in-part-a-indicate-about-the-relationship-between-the-pa648
(Solved): (b) What does the scatter diagram developed in part (a) indicate about the relationship between the ...

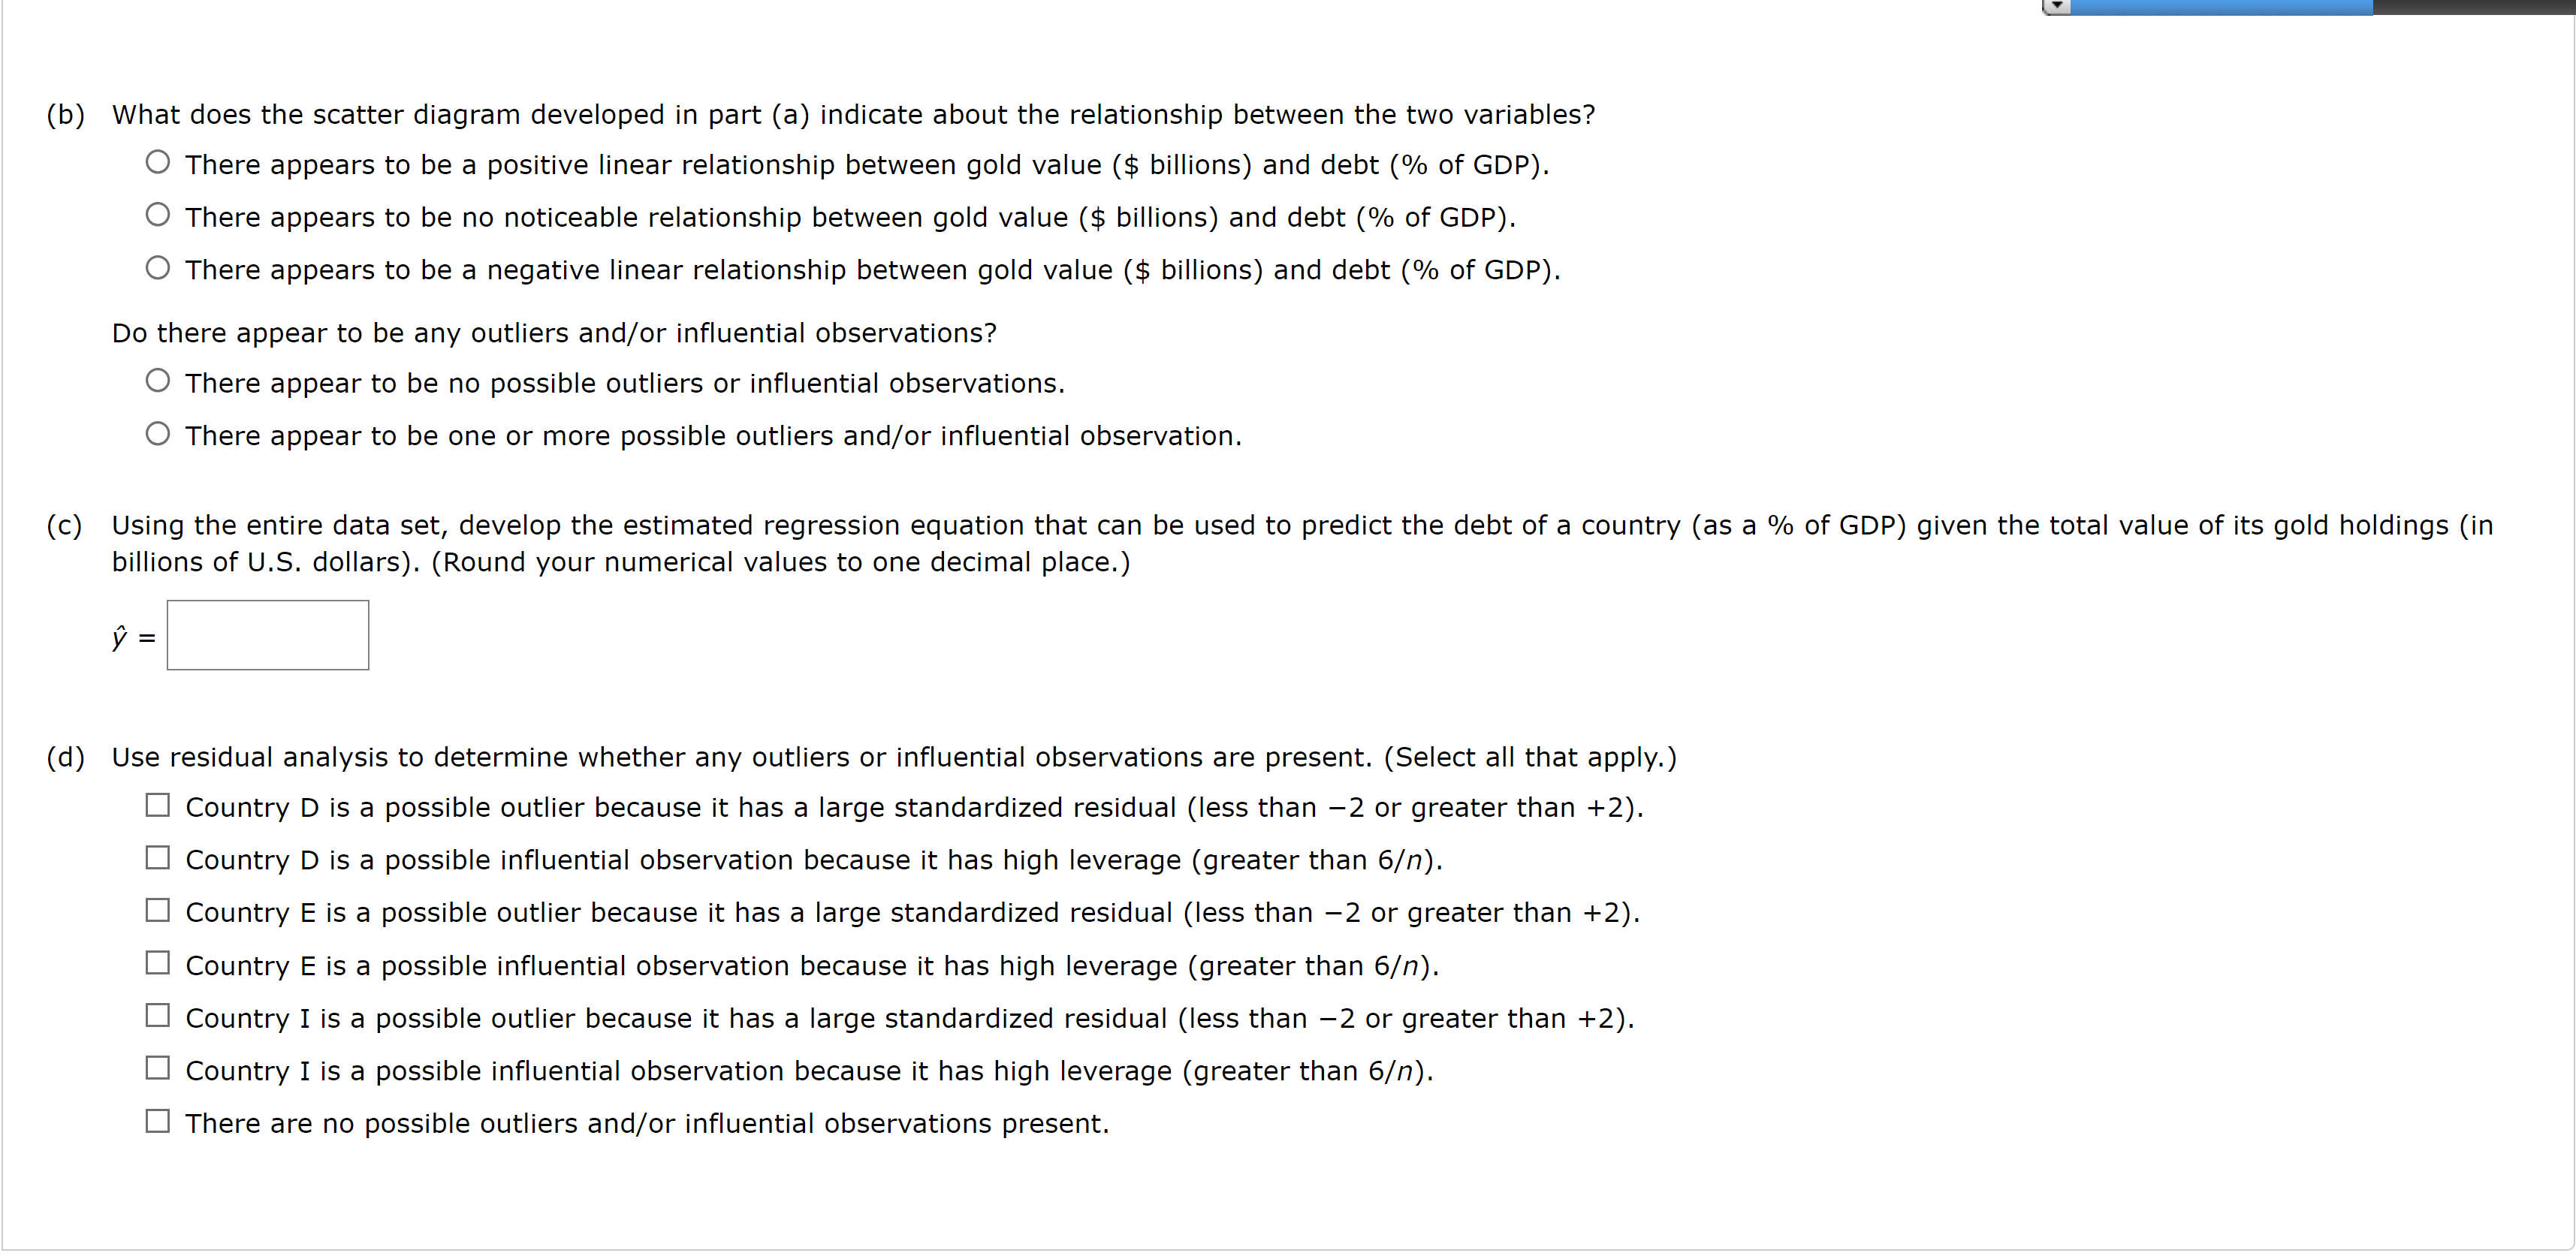
(b) What does the scatter diagram developed in part (a) indicate about the relationship between the two variables? There appears to be a positive linear relationship between gold value ( billions) and debt (\% of GDP). There appears to be no noticeable relationship between gold value (\$ billions) and debt (\% of GDP). There appears to be a negative linear relationship between gold value ( billions) and debt (\% of GDP). Do there appear to be any outliers and/or influential observations? There appear to be no possible outliers or influential observations. There appear to be one or more possible outliers and/or influential observation. billions of U.S. dollars). (Round your numerical values to one decimal place.) (d) Use residual analysis to determine whether any outliers or influential observations are present. (Select all that apply.) Country is a possible outlier because it has a large standardized residual (less than -2 or greater than +2 ). Country is a possible influential observation because it has high leverage (greater than ). Country is a possible outlier because it has a large standardized residual (less than -2 or greater than +2 ). Country is a possible influential observation because it has high leverage (greater than ). Country I is a possible outlier because it has a large standardized residual (less than -2 or greater than +2 ). Country I is a possible influential observation because it has high leverage (greater than ). There are no possible outliers and/or influential observations present.